User guide
Upload and analyze log file(s)
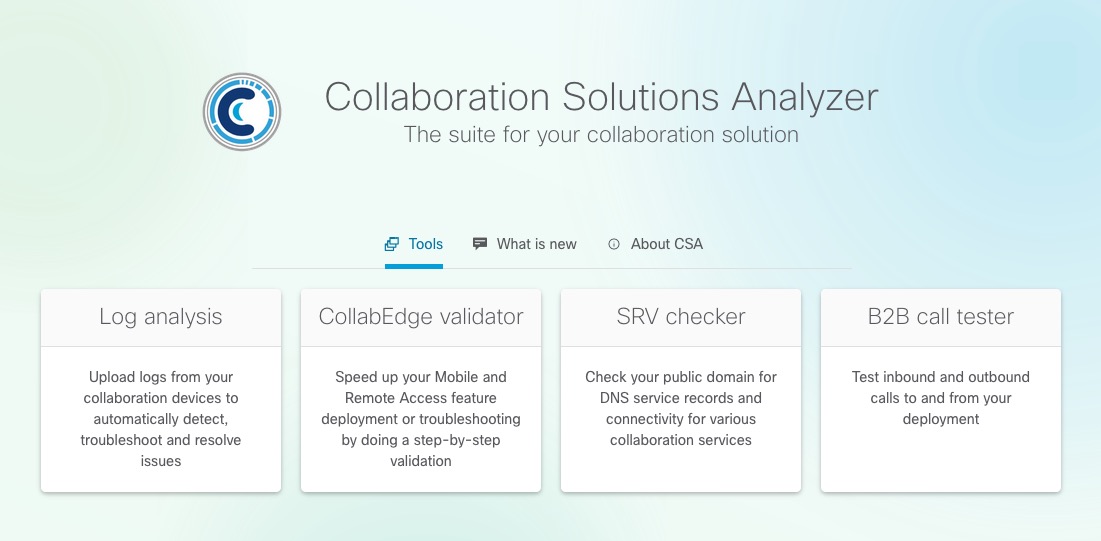
On the main screen, select the Log analysis tool.
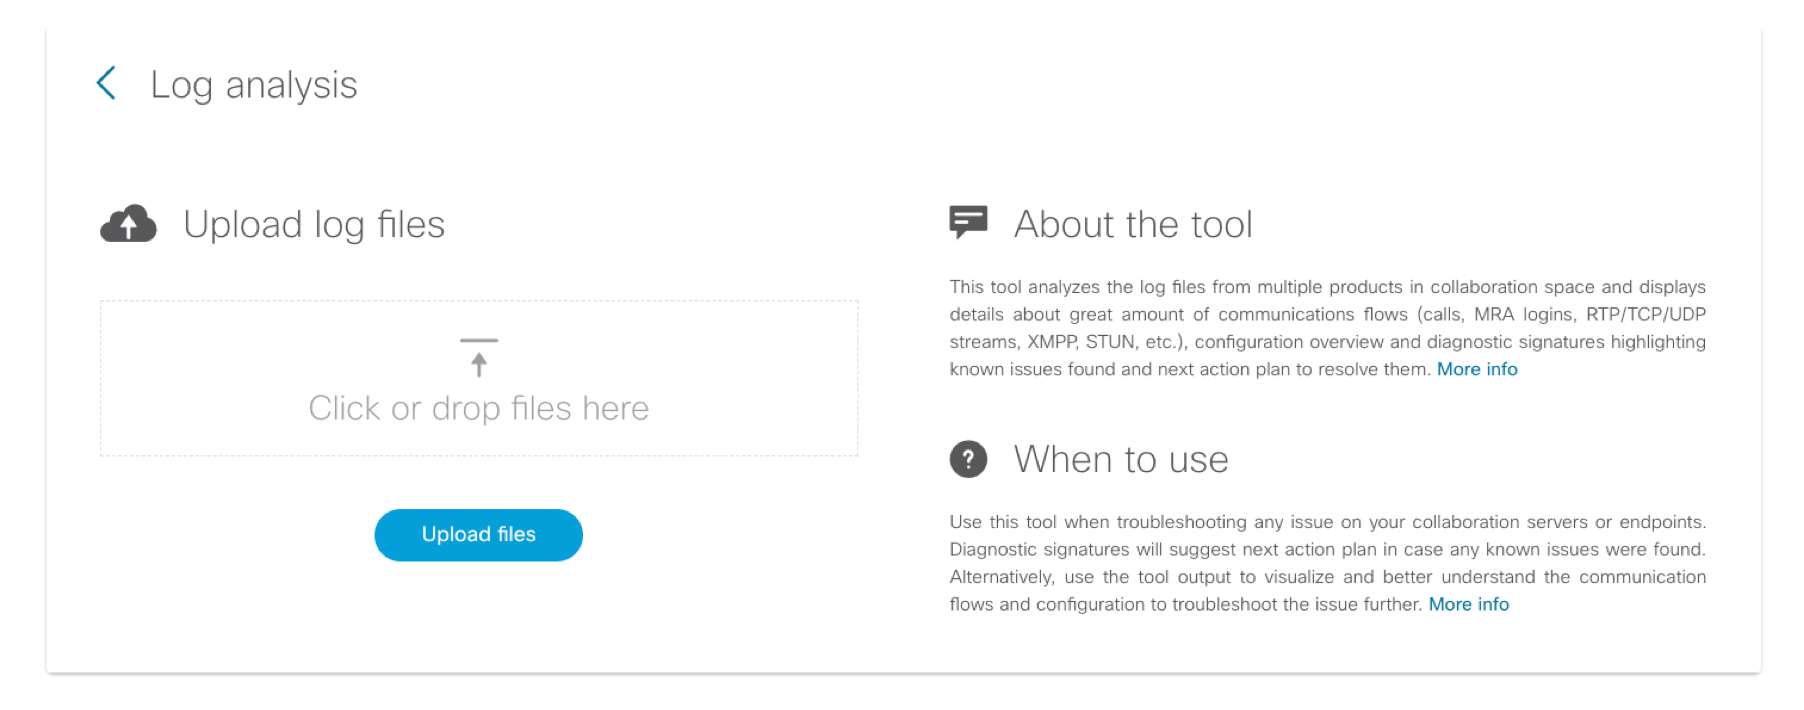
You can upload new files by dragging them over to the dropzone and then clicking Upload.
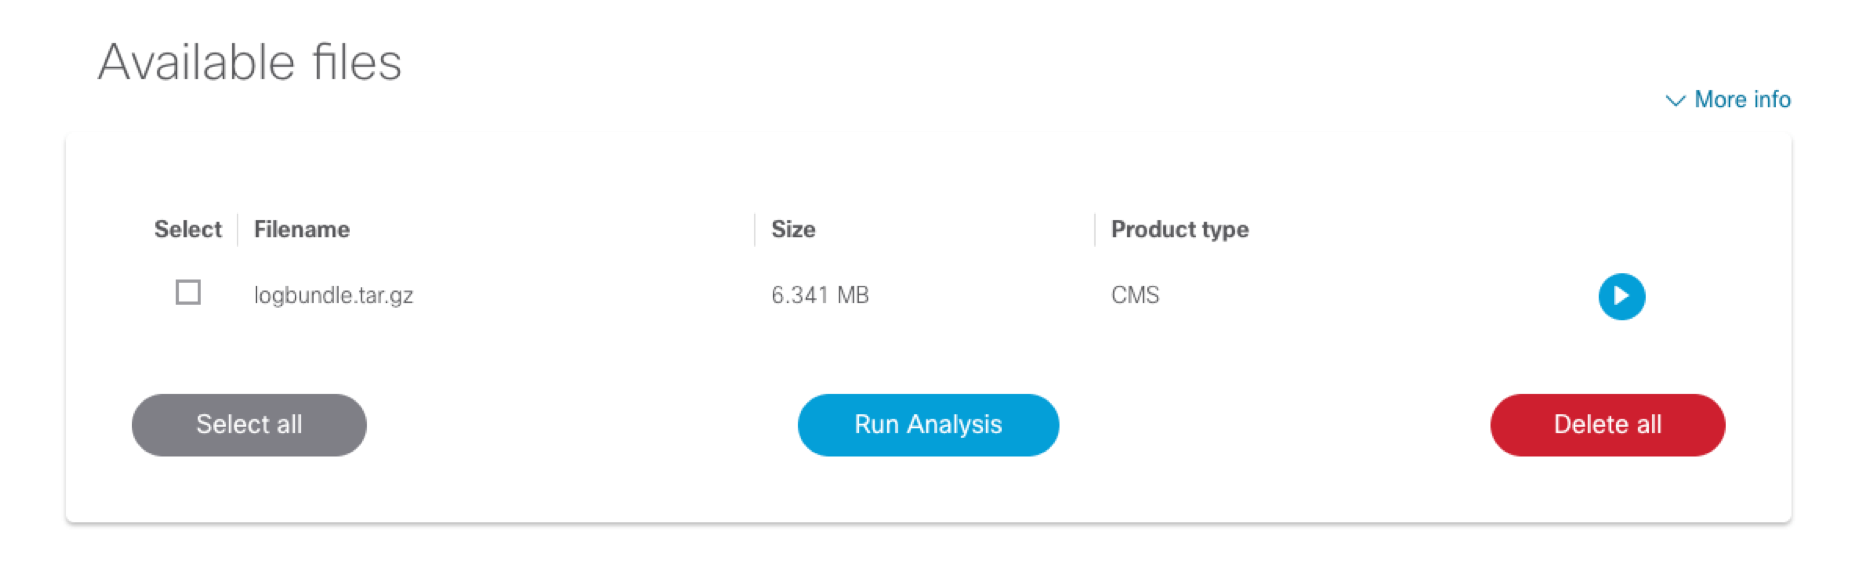
CSA will then load the files and automatically detect the product type. The list of files available for analysis is the listed under Available files. You can see the file name, size and product type.
Note
If the product type is not automatically detected, the file you have uploaded may be corrupt or it is not supported by the tool. For the list of the supported products and log file formats please refer to this document: Product and feature support.
You can select one or more files at once and hit Run Analysis button to start the analysis. As discussed in the following Analysis section, the output shown will differ for single or multiple file analysis.
Packet captures (PCAPs)
Packet capture files (.pcap, .pcapng) have their own product type and can be used in several ways when selected for analysis:
Single standalone pcap will be result in single product (pcap) analysis.
Multiple pcap files without any other product result in multiple pcap files analysis. Each pcap is treated individually.
Selecting one or more pcaps along with one other product will result in the pcaps being associated with that one product and the information extracted from pcap files will be used in the main product analysis. This is useful when the packet captures were upload separately to main product archive.
Selecting multiple products and one or more pcaps will result in pcaps being analyzed individually as we can’t know to which product to link them to.
Note
Any pcap file that is contained within a folder or archive that was identified as specific product will be automatically associated with this product. If multiple products each having one or more pcaps need to be analyzed at once, the way to do it is to create an archive for each product containing the product logs and the pcaps and then select the archive with particular product type for analysis. The above only applies when pcap files are individually selected and identified as pcap product type.
Analysis
Files selected for analysis are parsed for system information and communication flows. If more than one file (product) was selected, the communication flows are correlated across these products and later on displayed in such way. Additionally, we try to automatically detect common configuration mistakes or known defects using our Diagnostic signatures.
The analysis display is organized in a top-to-bottom flow including the following sections, which are described in more detail below:
Diagnostic signatures (both CSA native and external integrations)
Multiple file analysis overview and analysis switcher (only when multiple products are selected)
System information
Log overview
Detail view
Top menu navigation
When analysis is done and the page scrolls below the initial input portion of the page, the top menu navigation bar is shown to allow for quicker navigation between sections.
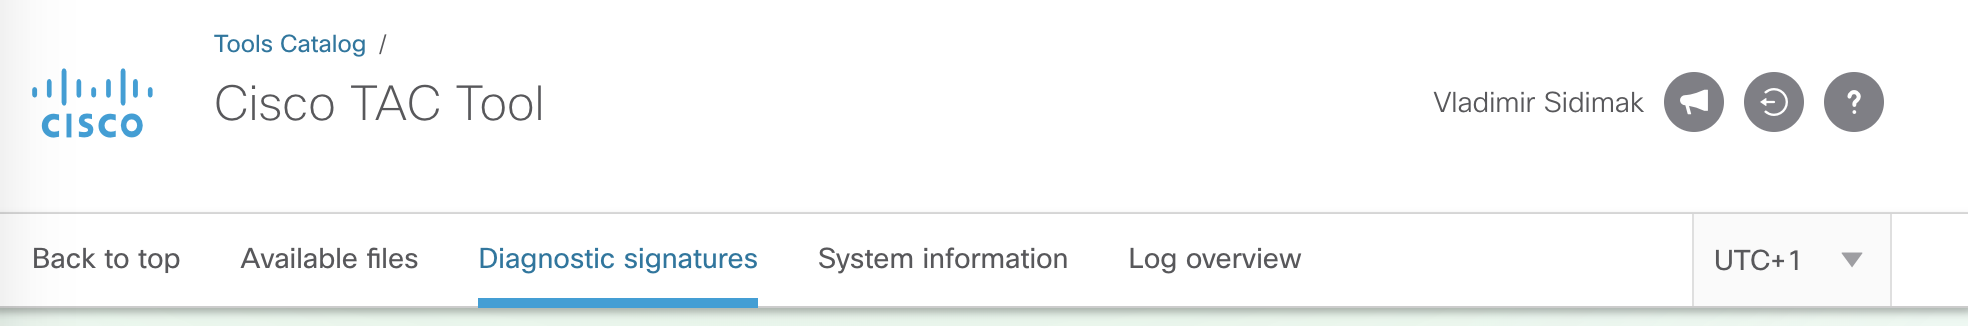
On the right part of the bar there is a timezone selector. By default, all the timestamps within CSA analysis (log overview, detail sections) are normalized to UTC. User has the option to change the timezone in which to see the timestamps and this value will be remembered.
Diagnostic signatures
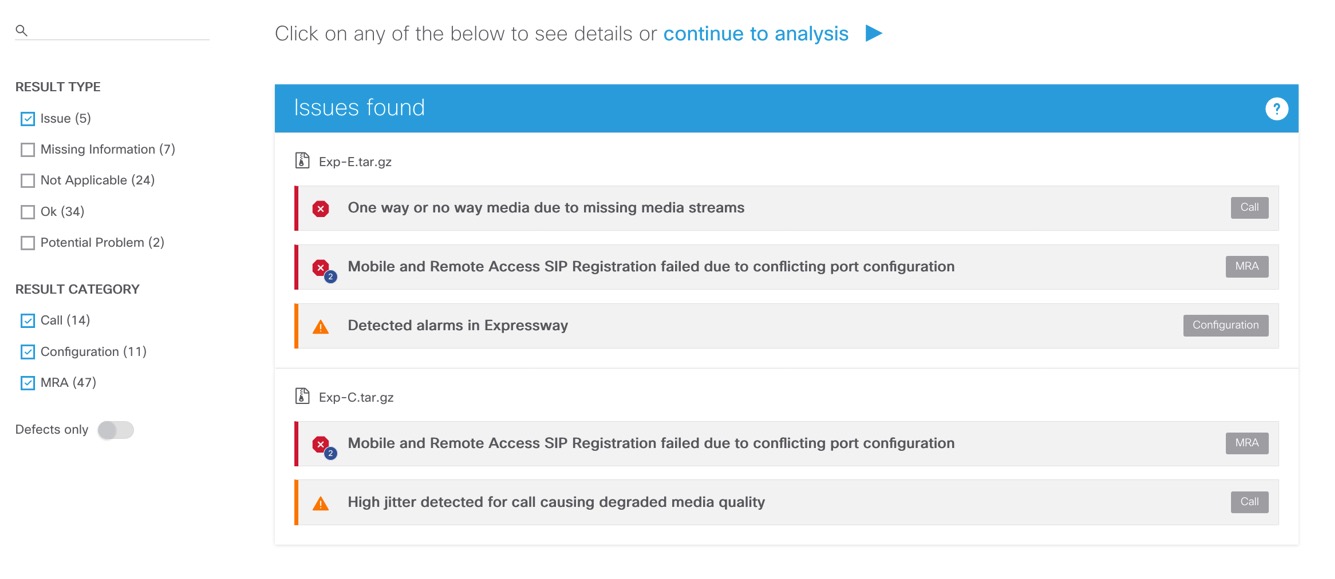
If any issues were found by diagnostic signatures, the first thing displayed to the user is the summary view of these issues. If no issues are found, the page scrolls down to System information section if one file was selected for analysis, or to Multiple analysis options section if more files were selected.
At the time of analysis first the CSA own diagnostic signatures are shown and other external diagnostic signatures sources are called in the background. This is indicated by the messages below and could result in more signatures matched once the process finishes:

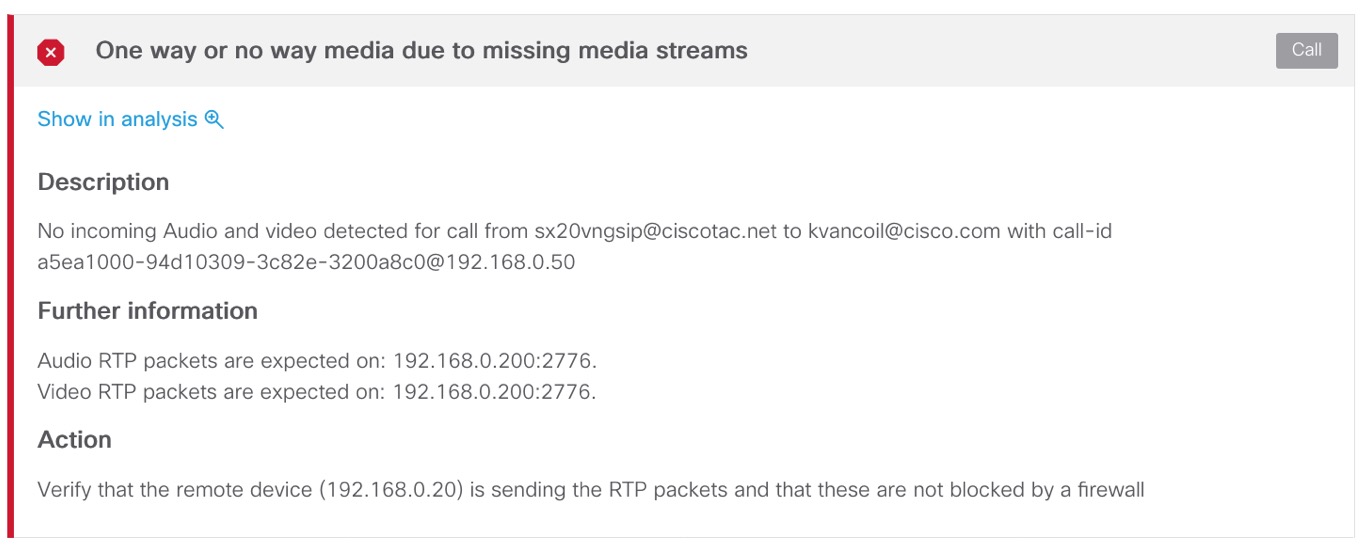
Clicking on any of the items shown will display more details about the issue including the more detailed issue description, appearance in logs and action plan to fix or further troubleshoot the issue. If there is a known defect related to the issue, or there is external document available, the link will be shown.
Some diagnostic signatures may contain a direct link Show in analysis to the communication flow in log analysis itself. To get to the log analysis, you can alternatively scroll down to System information section or click on Continue to analysis link above the Diagnostic signature list.
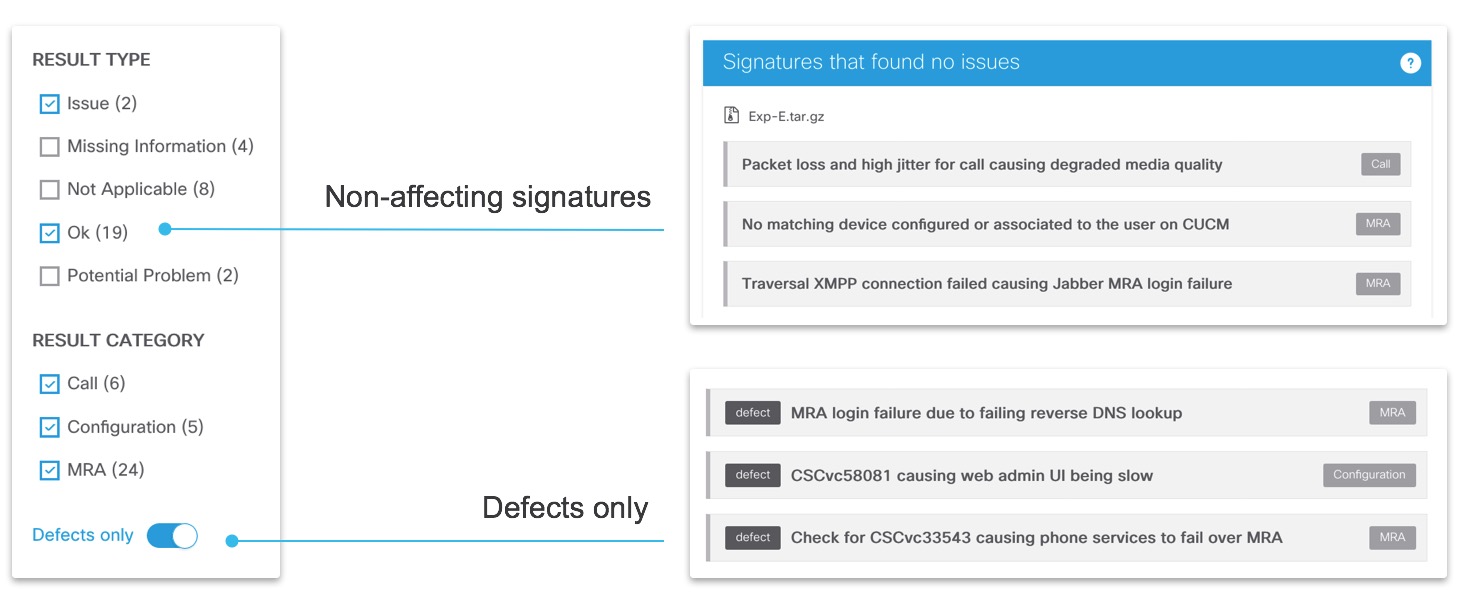
If you’re interested in seeing what other diagnostic signatures were run, but did not find any issues, you can select other Result type in the control panel on the left. More information about the specific result type is shown when hovering over the ? button on the top right of the diagnostic signatures list. Additionally there is a toggle button to only show defect-related diagnostic signatures.
All diagnostic signatures are listed here
Multiple analysis options
When more files were selected for analysis, we analyze the logs and present the information in 2 ways:
Combined analysis - Here we correlate the communication flows across multiple products and show the flow across these products. There is less specific product analysis shown.
Individual product analysis - All the data analyzed on individual product is shown, but no correlation to other products is done.
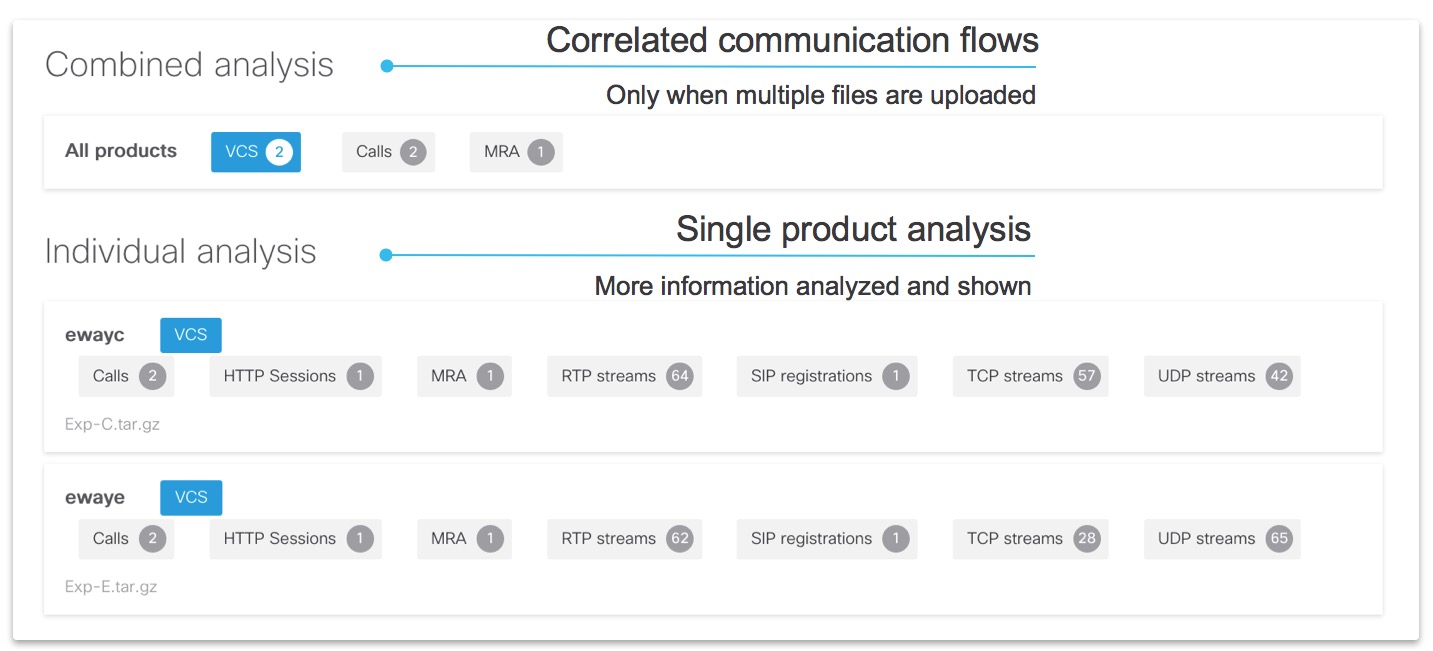
Idea here is that combine analysis should provide the high level view on the flow, and may help with identifying which product may be causing issue. Then, the individual analysis can be reviewed for more information on that product. You can swap between the different analysis options at any time. Selecting an analysis will move the page to System information section.
System information
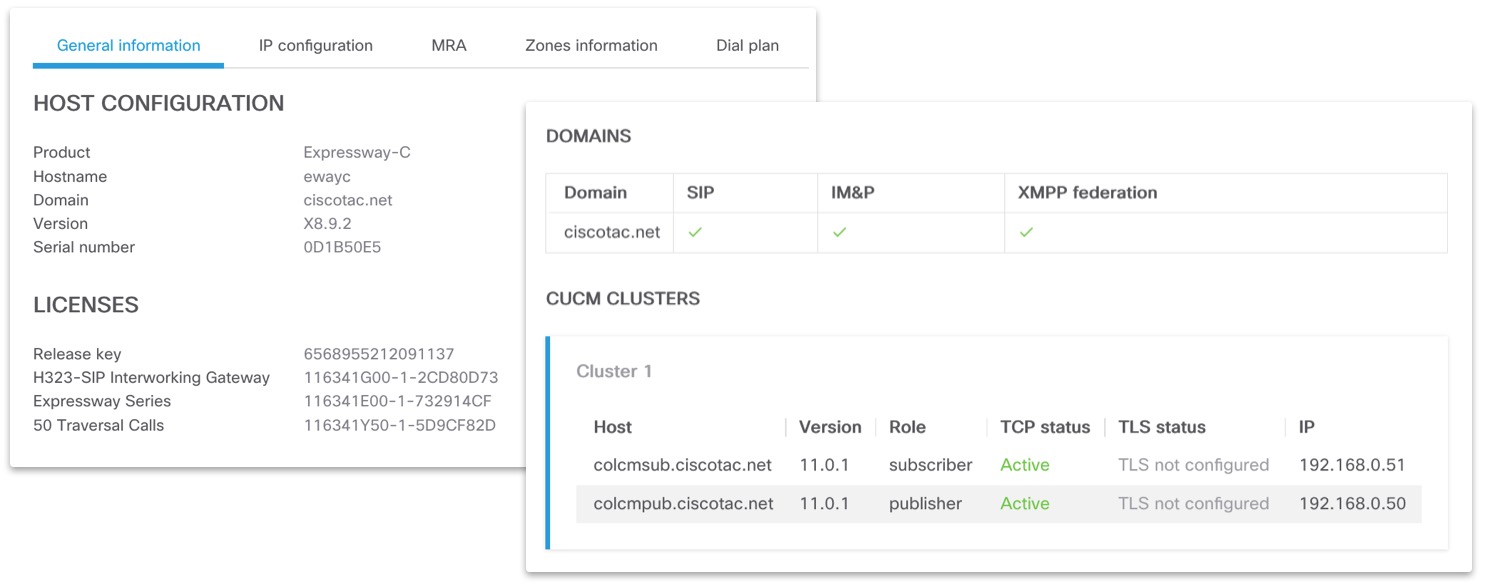
This section shows system status and configuration gathered from the product logs, which is often used for troubleshooting. The output varies for different products.
CMS console
If live.json is present in the CMS archive uploaded to the tool, the CMS console is shown and works the same as the actual MMP console of the CMS server, when you connect to it over console or SSH.
Note
Not all the MMP commands are supported, and it will be indicated by the console if unsupported command is entered.
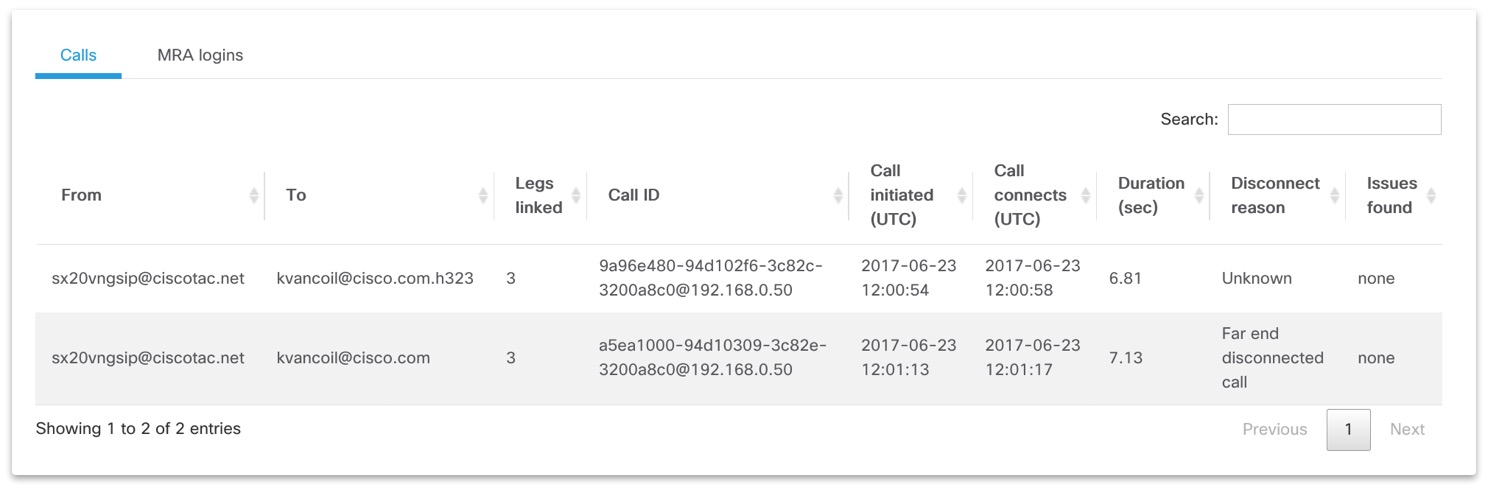
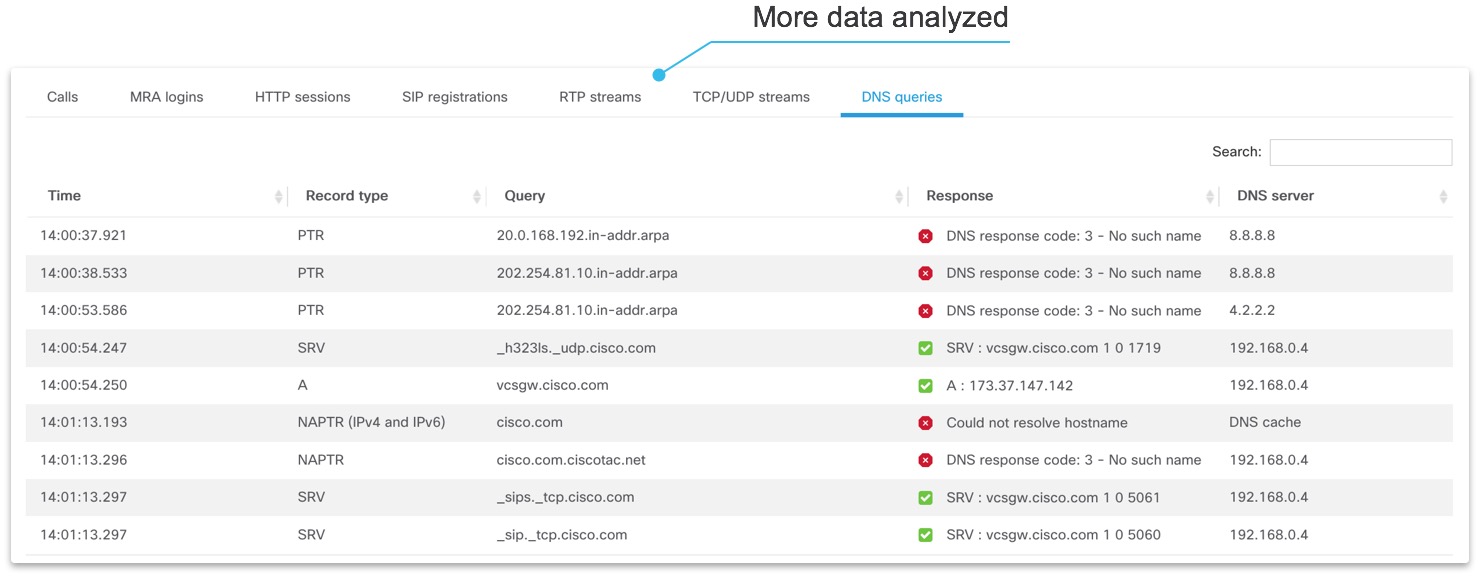
Log overview
The section displays the communication flows found in logs organised in tabs. Each tab contains the list of all the flows found that can be sorted and/or searched through using the search input field. With multiple files selected for analysis, the amount of information shown depends based on type of analysis chosen. See the above Multiple analysis options section for more information.
Combined analysis
Single product analysis
Clicking on any item in the table for some of the tabs will display a detailed view for the communication flow as shown in next section.
Detail
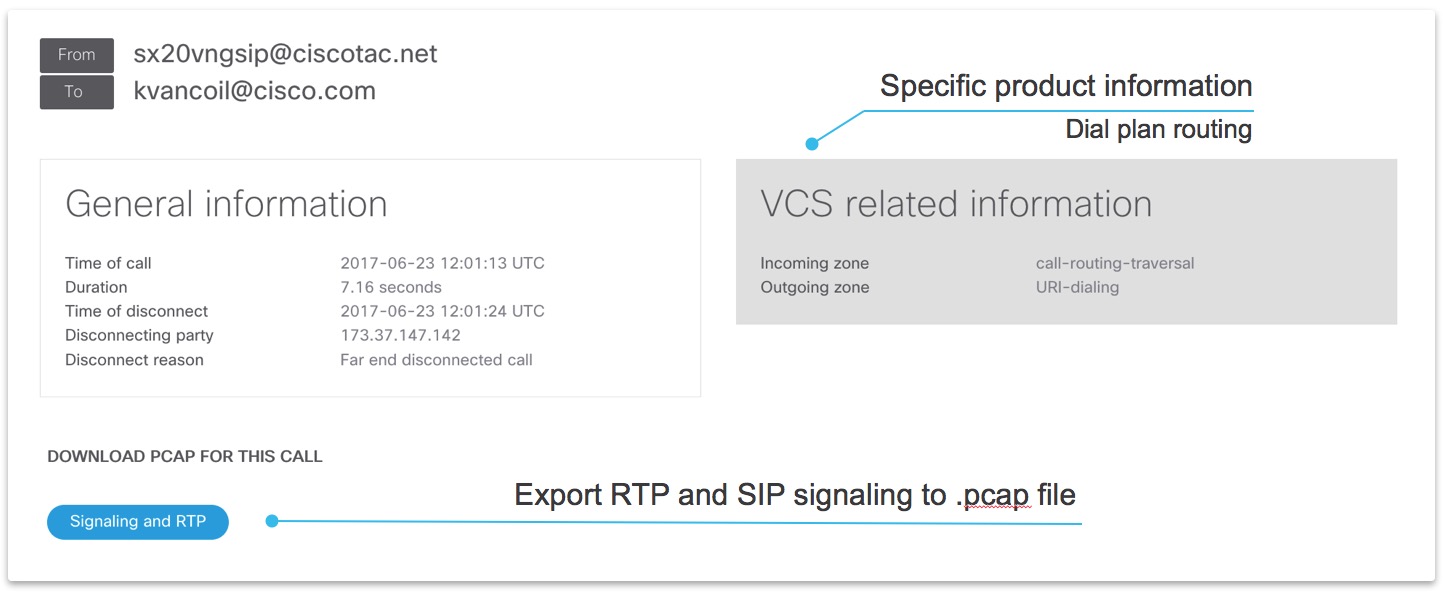
After clicking on item in the table in Log overview section more details are shown for the particular communication flow. Below are some examples for SIP/H323 calls.
Single product analysis - SIP call
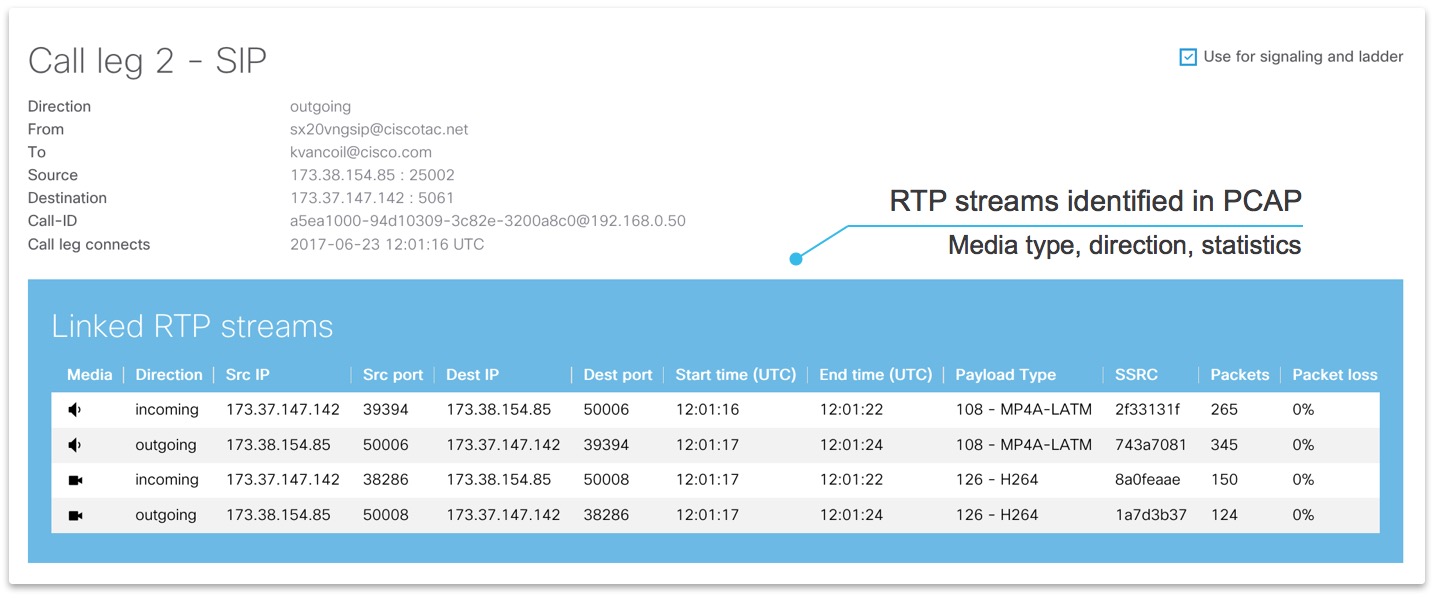
General call information
RTP streams linked to SIP call
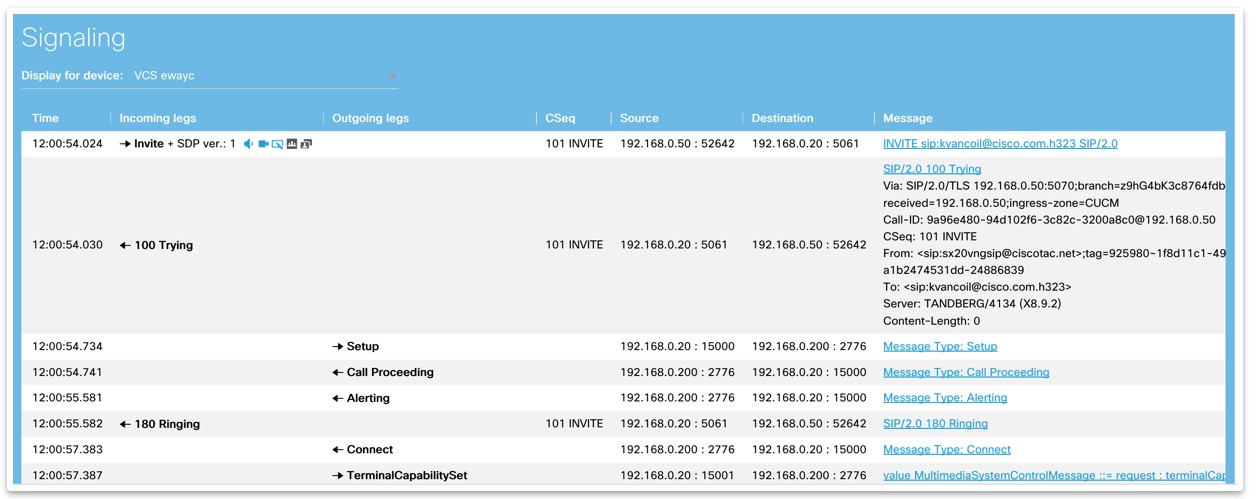
Signaling
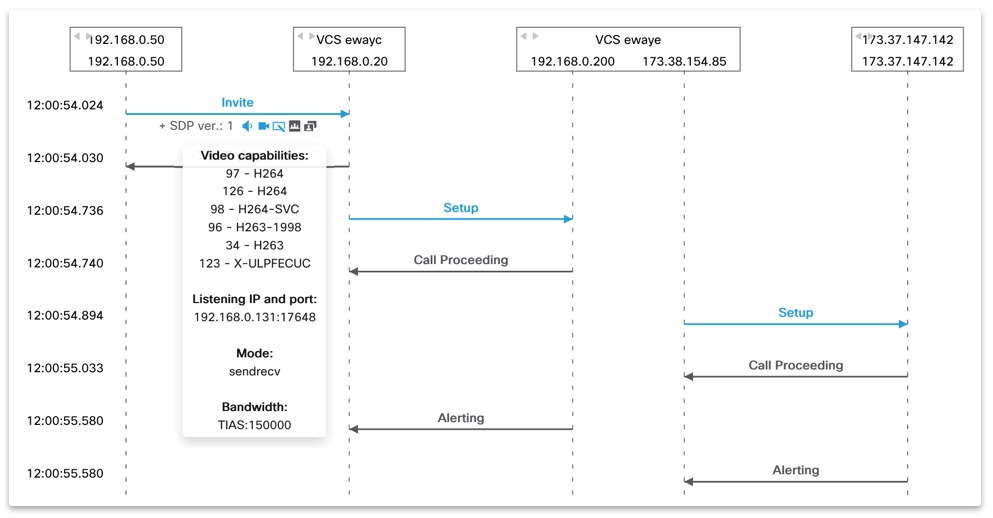
Multiple products analysis - ladder diagram of SIP call
STUN
This section explains how to read the tables in the STUN tab.
Allocate Requests
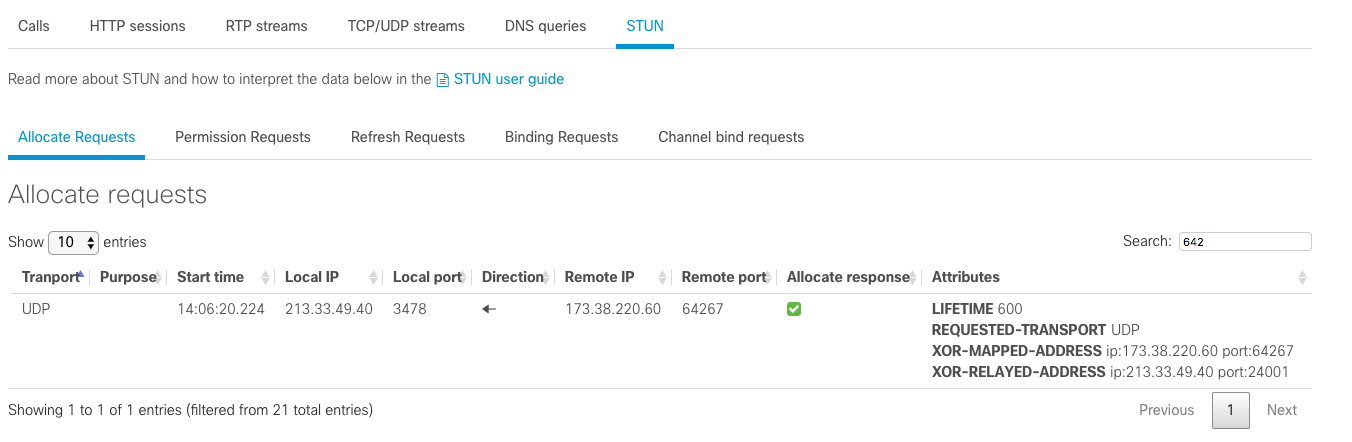
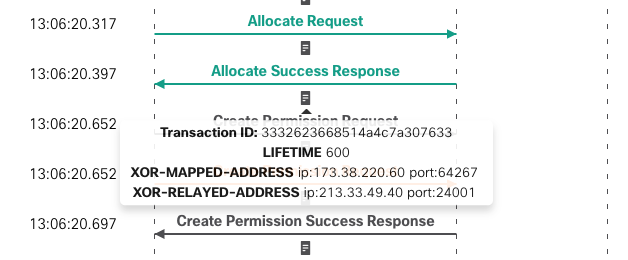
In the above screenshot, we can see that 173.38.220.60:64267 has sent an Allocate Request to 213.33.49.40.
213.33.49.40 has responded with an Allocate Success Response with the NATted address of 173.38.220.60 (XOR-MAPPED-ADDRESSED) and
the address of the relay and the port allocated by the relay.
When clicking on one of the rows, we can see the all the STUN messages related to the allocation in a ladder:
When hovering the icons, additional information is provided:
Permission Requests
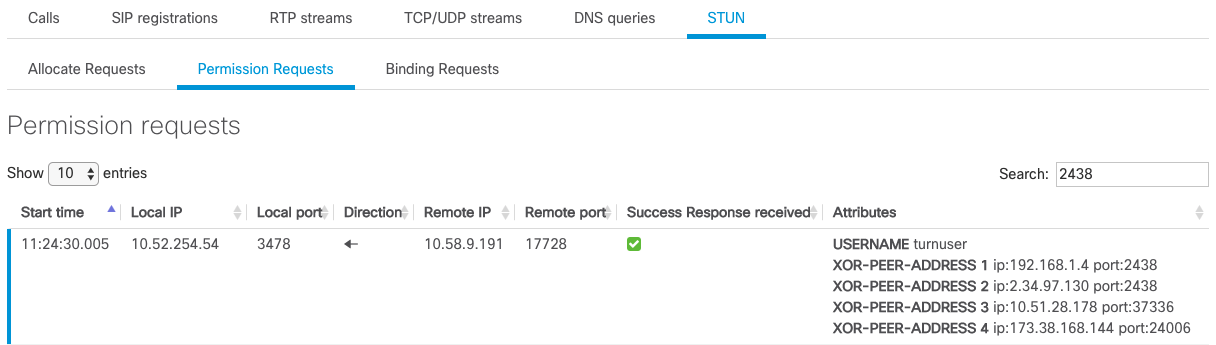
In the above screenshot, we can see that 10.58.9.191 has sent a Create Permission Request to 10.52.254.54 to allow traffic from the below addresses to be forwarded to 10.58.9.191:17728 :
- 192.168.1.4:2438
- 2.34.97.130:2438
- 10.51.28.179:37336
- 173.38.168.144:24006
A Create Permission Success Response has been sent by 10.52.254.54 to 10.58.9.191.
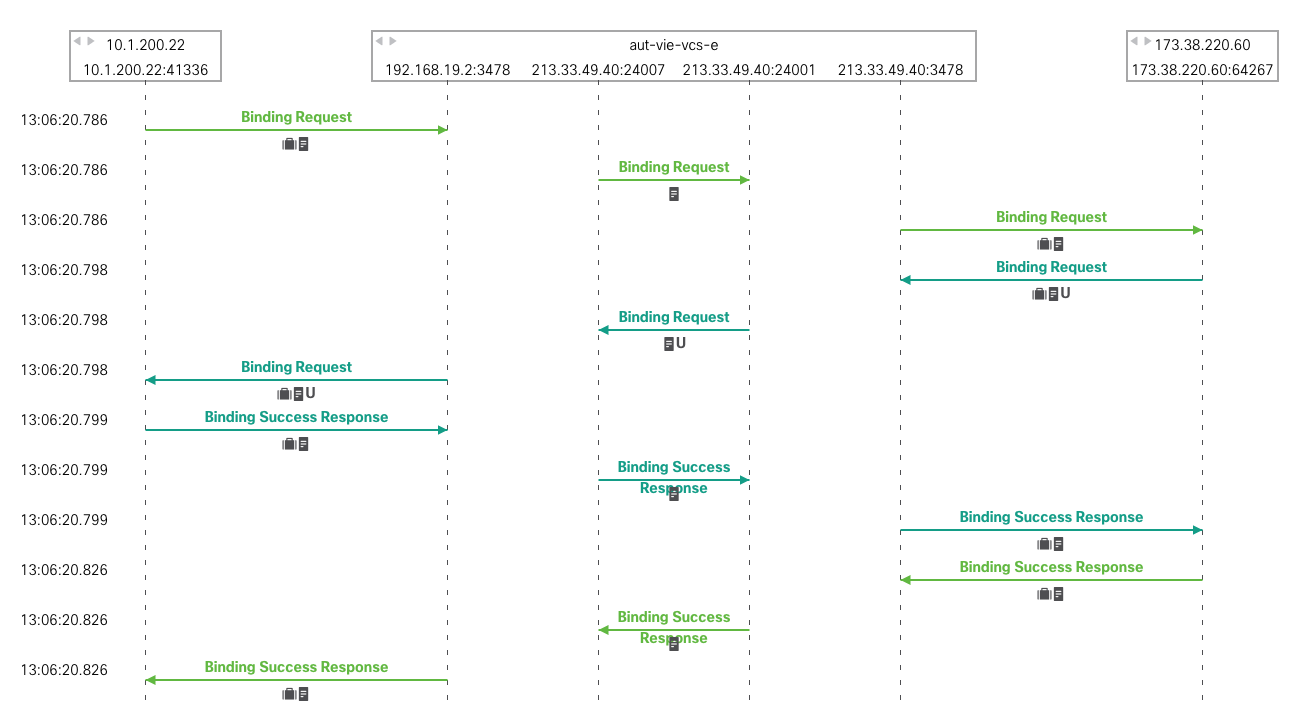
Binding Requests
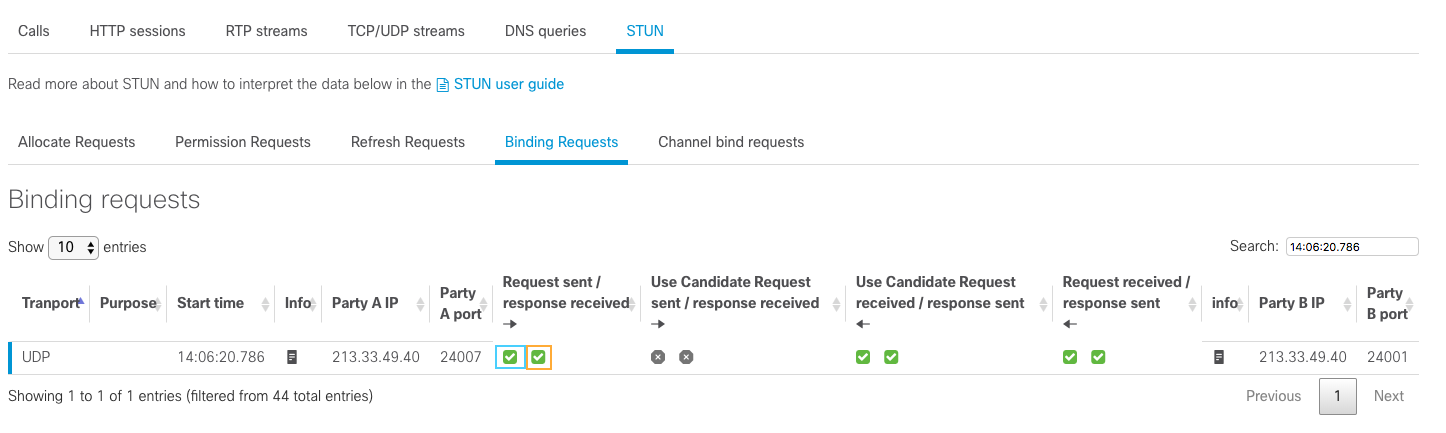
The green checkbox highlighted in blue means that 213.33.49.40:24007 has sent a Binding Request to 213.33.49.40:24001 while the green checkbox highlighted in orange means that a Binding Success Response has been sent from 213.33.49.40:24001 to 213.33.49.40:24007. If the checkbox highlighted in orange was red, it would mean that no Binding Success Response has been received by 213.33.49.40:24007.
When clicking on one of the rows, we can see the details of the stream:

The highlighted checkboxes in the above means that 60.60.60.100:2338 has sent a Bind Request to 10.10.10.10:2330 and has received a Binding Success Response.
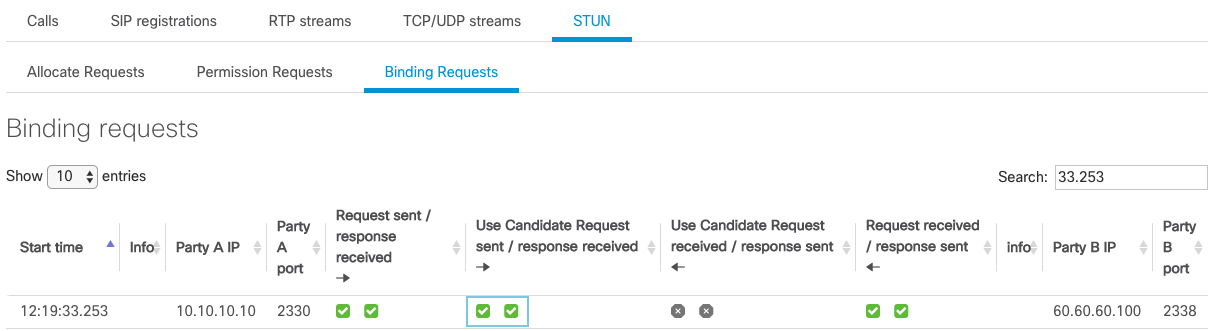
The highlighted checkboxes in the above means that 10.10.10.10:2330 has sent a Bind Request with the Use-Candidate attribue to 60.60.60.100:2338 and has received a Binding Success Response.
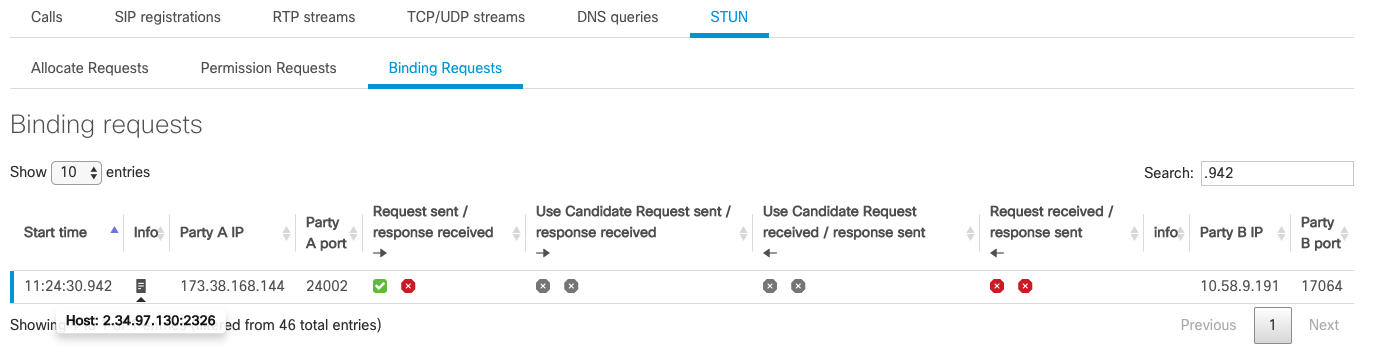
In the above screenshot, when hovering over the sheet icon, the IP address and port of the host will be displayed.
This means that the binding request sent from 173.38.168.144:24002 to 10.58.9.191:17064 has been initiated by a STUN Send Indication from 2.34.97.130:2326.
We can verify it by:
- clicking on a row to get the details
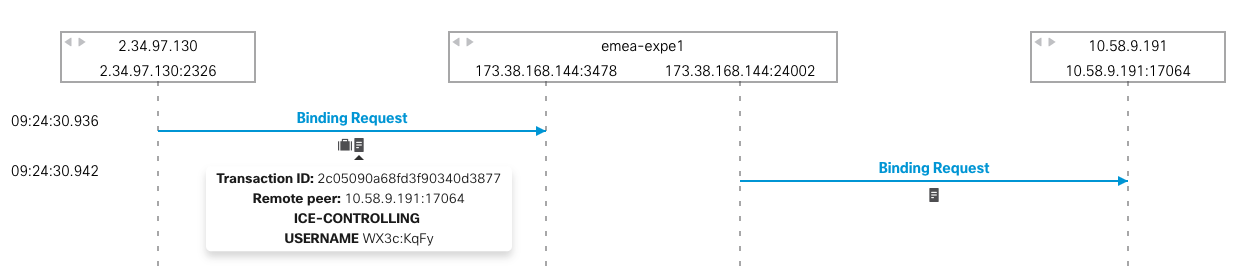
- take note of the the transaction ID
- open the packet capture
- filter with “stun.type==0x0016 and data.data contains [transactionID]”. The transactionID should be edited to insert “:” after every 2 charachters
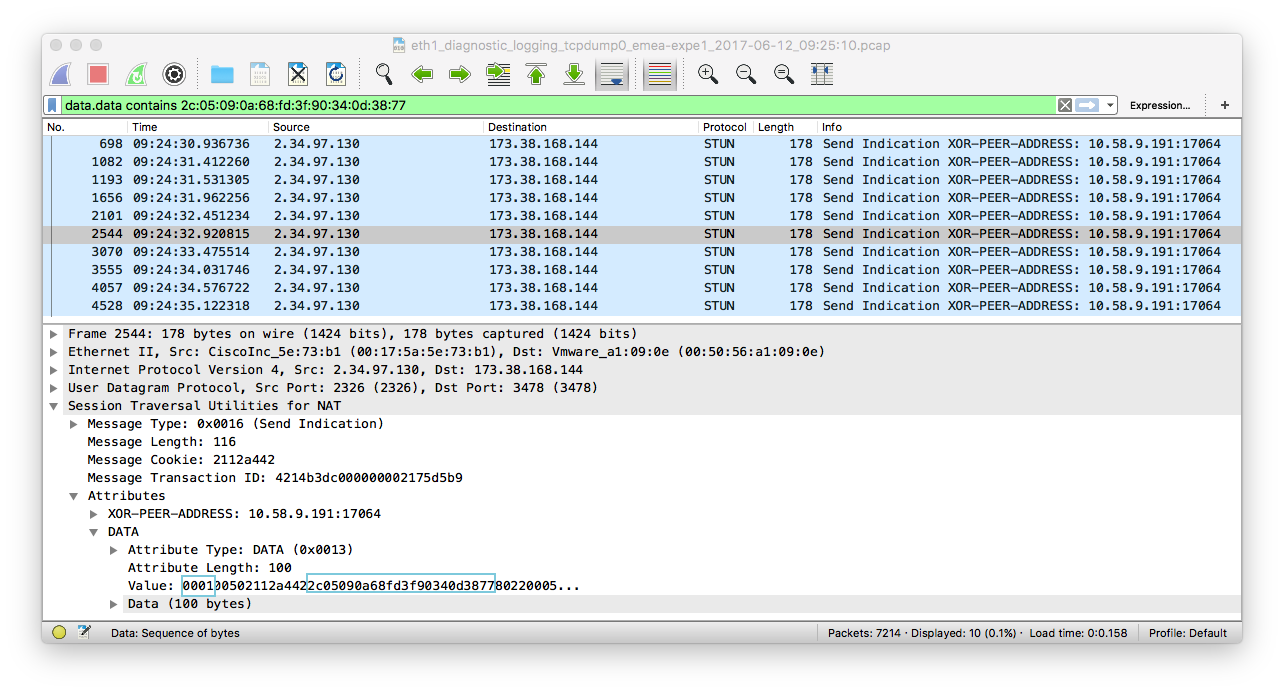
We can see that the first 4 hex is 0001 of the data (highlighted in blue). This means that the Send Indication message contains a STUN Binding Request message.
A couple of hexadecimal after (just after the STUN magic cookie) we can find the transaction ID.
- We can now filter the packet capture with “stun.id == [transactionID]”
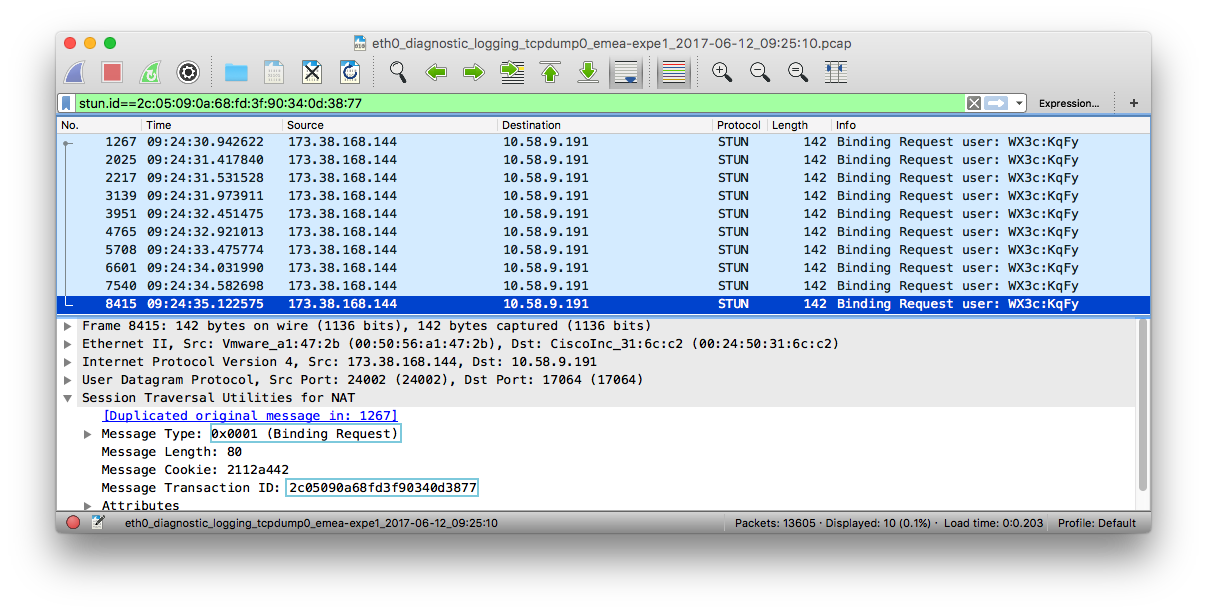
We can see that the message type is 0x0001 (Binding Request) and the transaction ID is the same. This message is the Binding Request sent from 173.38.168.144:24002 to 10.58.9.191:17064 initiated by the
Send Indication.
Channel Bind Requests
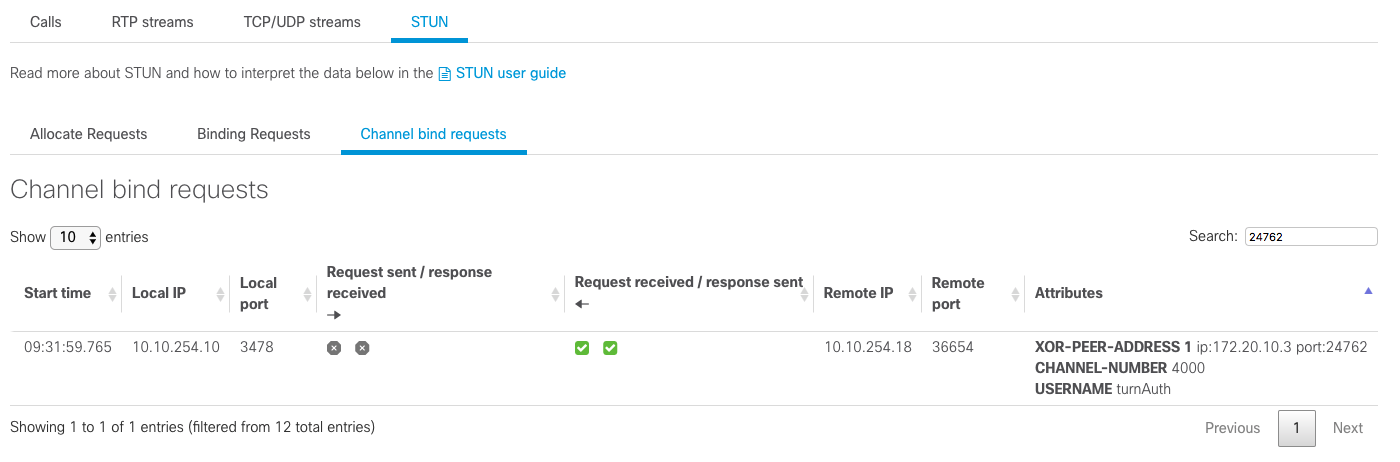
In the screenshot above, we can see that 10.10.254.18:36654 sent a Channel Bind Request to 10.10.254.10:3478 and received a Channel Bind Success Response. The channel number that will be used fot Channel Data is 0x4000.