Usage Example#
This guide demonstrates how to use the Crash Dump Analyzer with a Call Manager service crash dump as the example.
Collecting the Crash Dump Information#
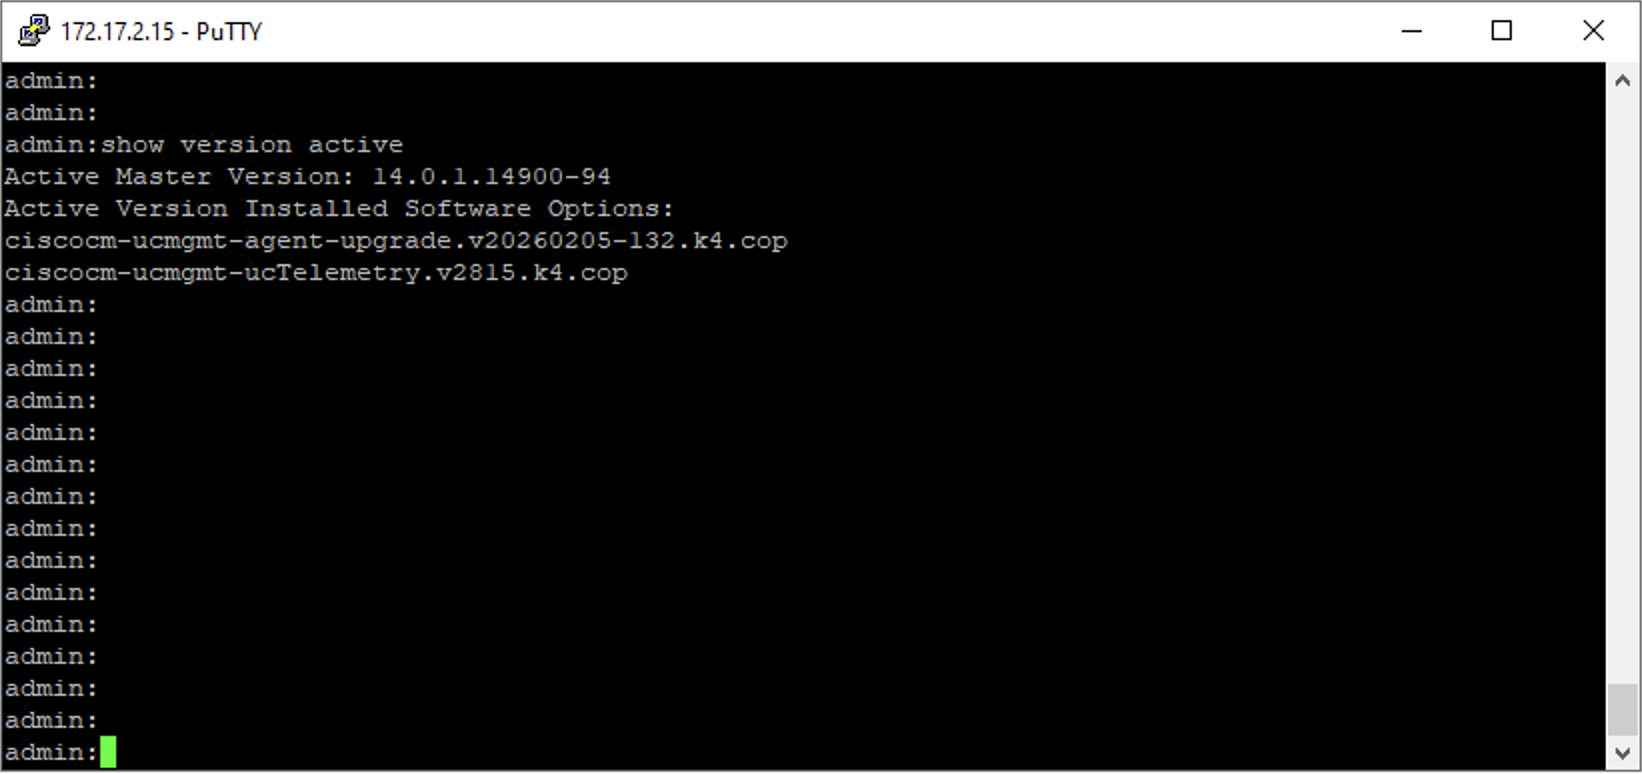
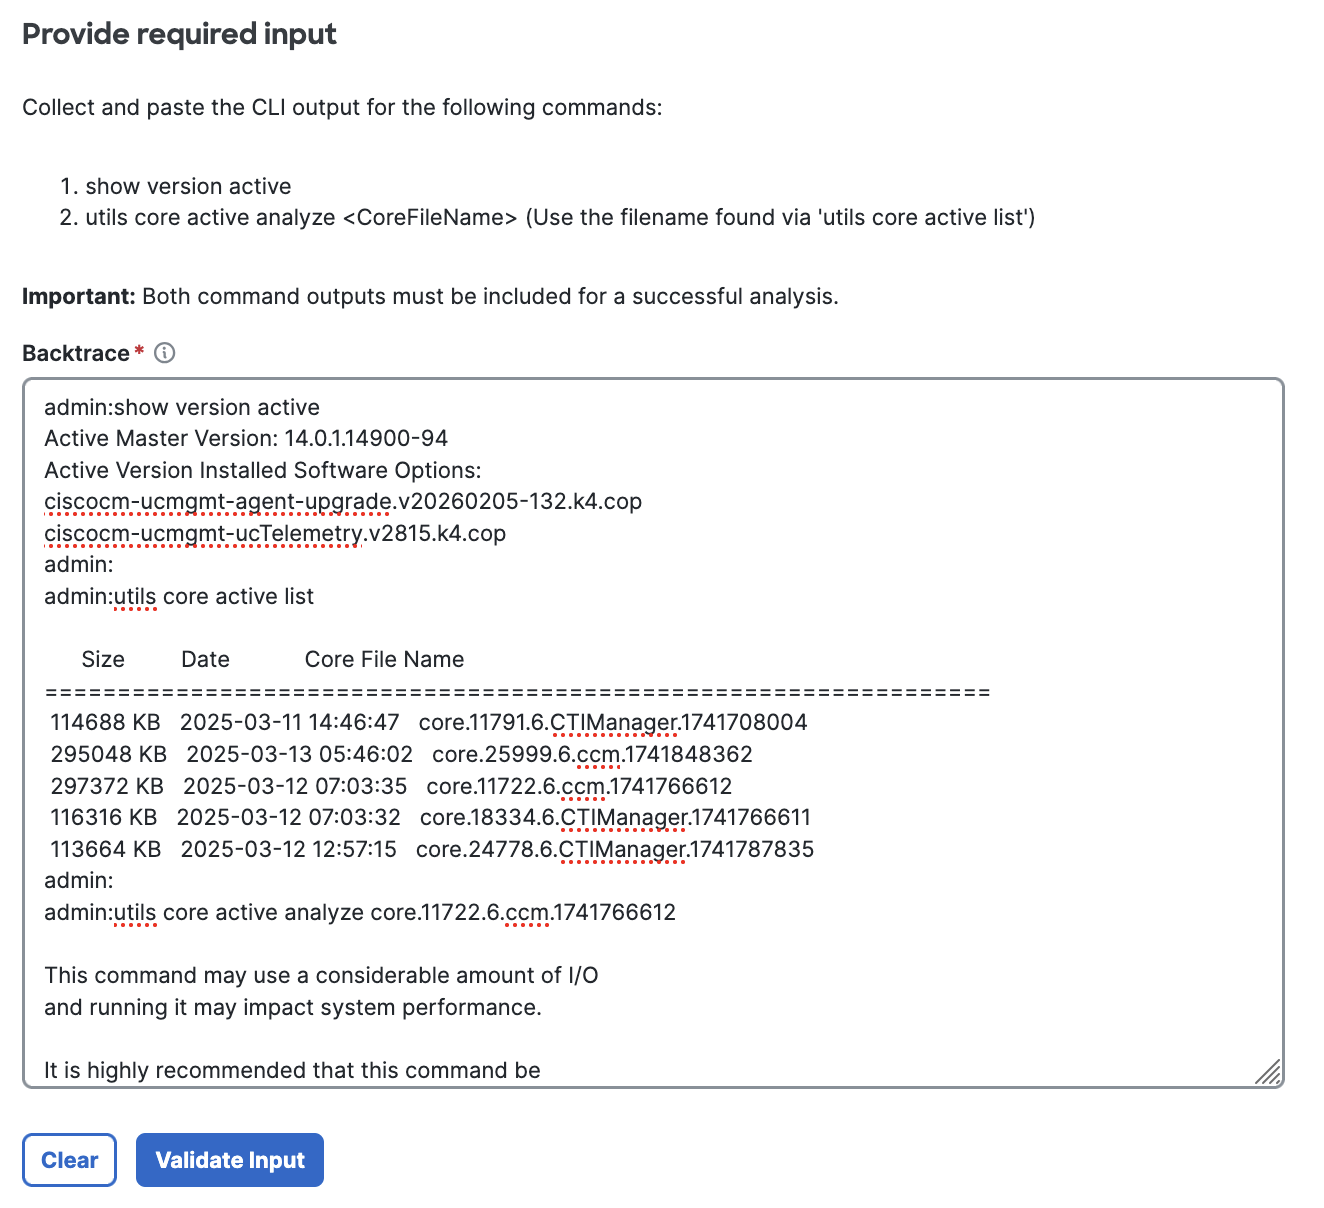
To ensure a successful analysis, collect the crash dump directly from the CLI of your UC appliance. Open your favorite SSH client, sign in to the UC appliance and run the command:
show version active
Next, run these commands to list and analyze core files:
utils core active list
utils core active analyze <CoreFileName_from_previous_command>
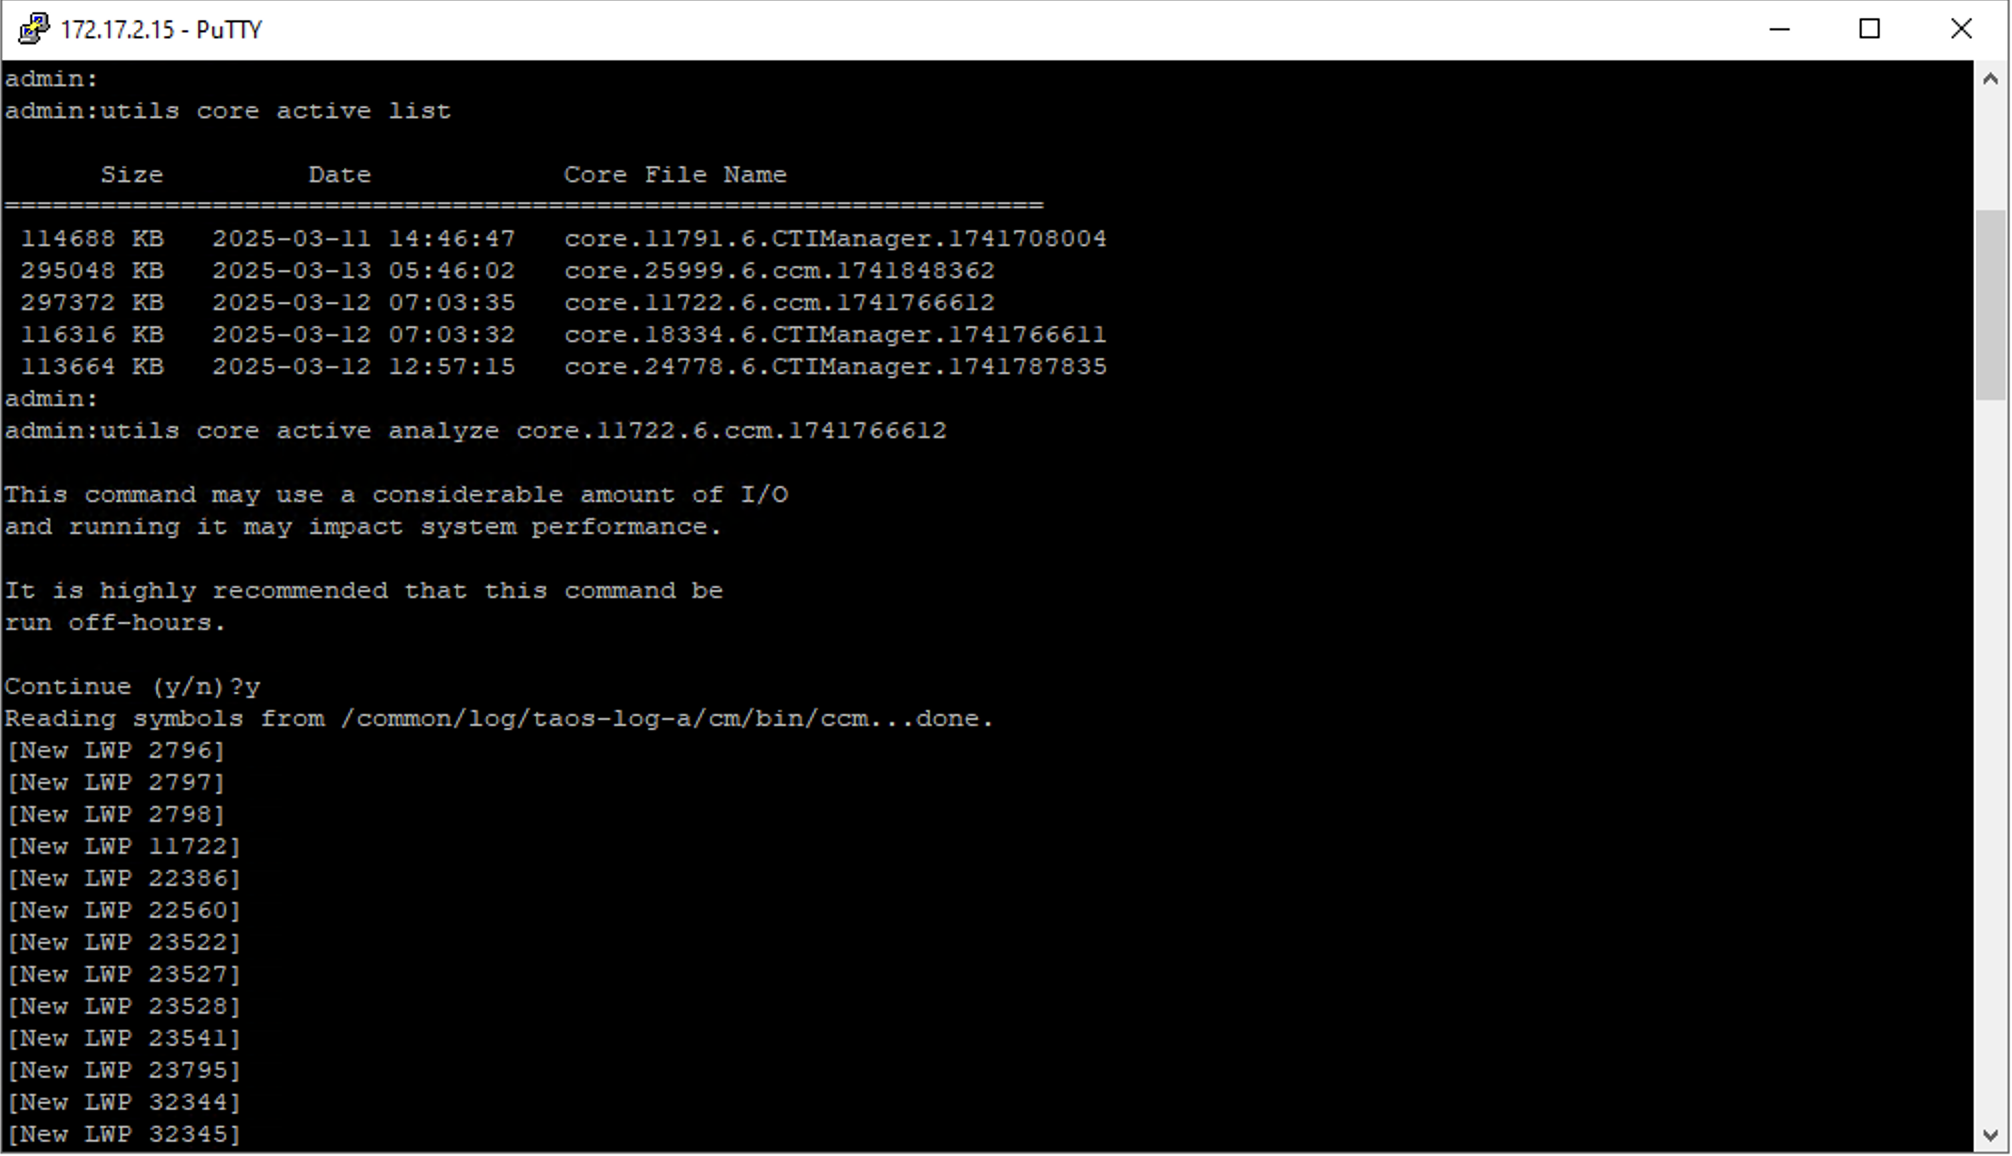
Note
Running the command utils core active analyze <CoreFileName> may use considerable I/O and impact system performance. It is highly recommended to run this command during off-hours.
Running the UC Crash Dump Analyzer#
Copy the output from all the above commands for a successful analysis. Paste them into the tool input and press the “Validate Input” button to start the analysis.
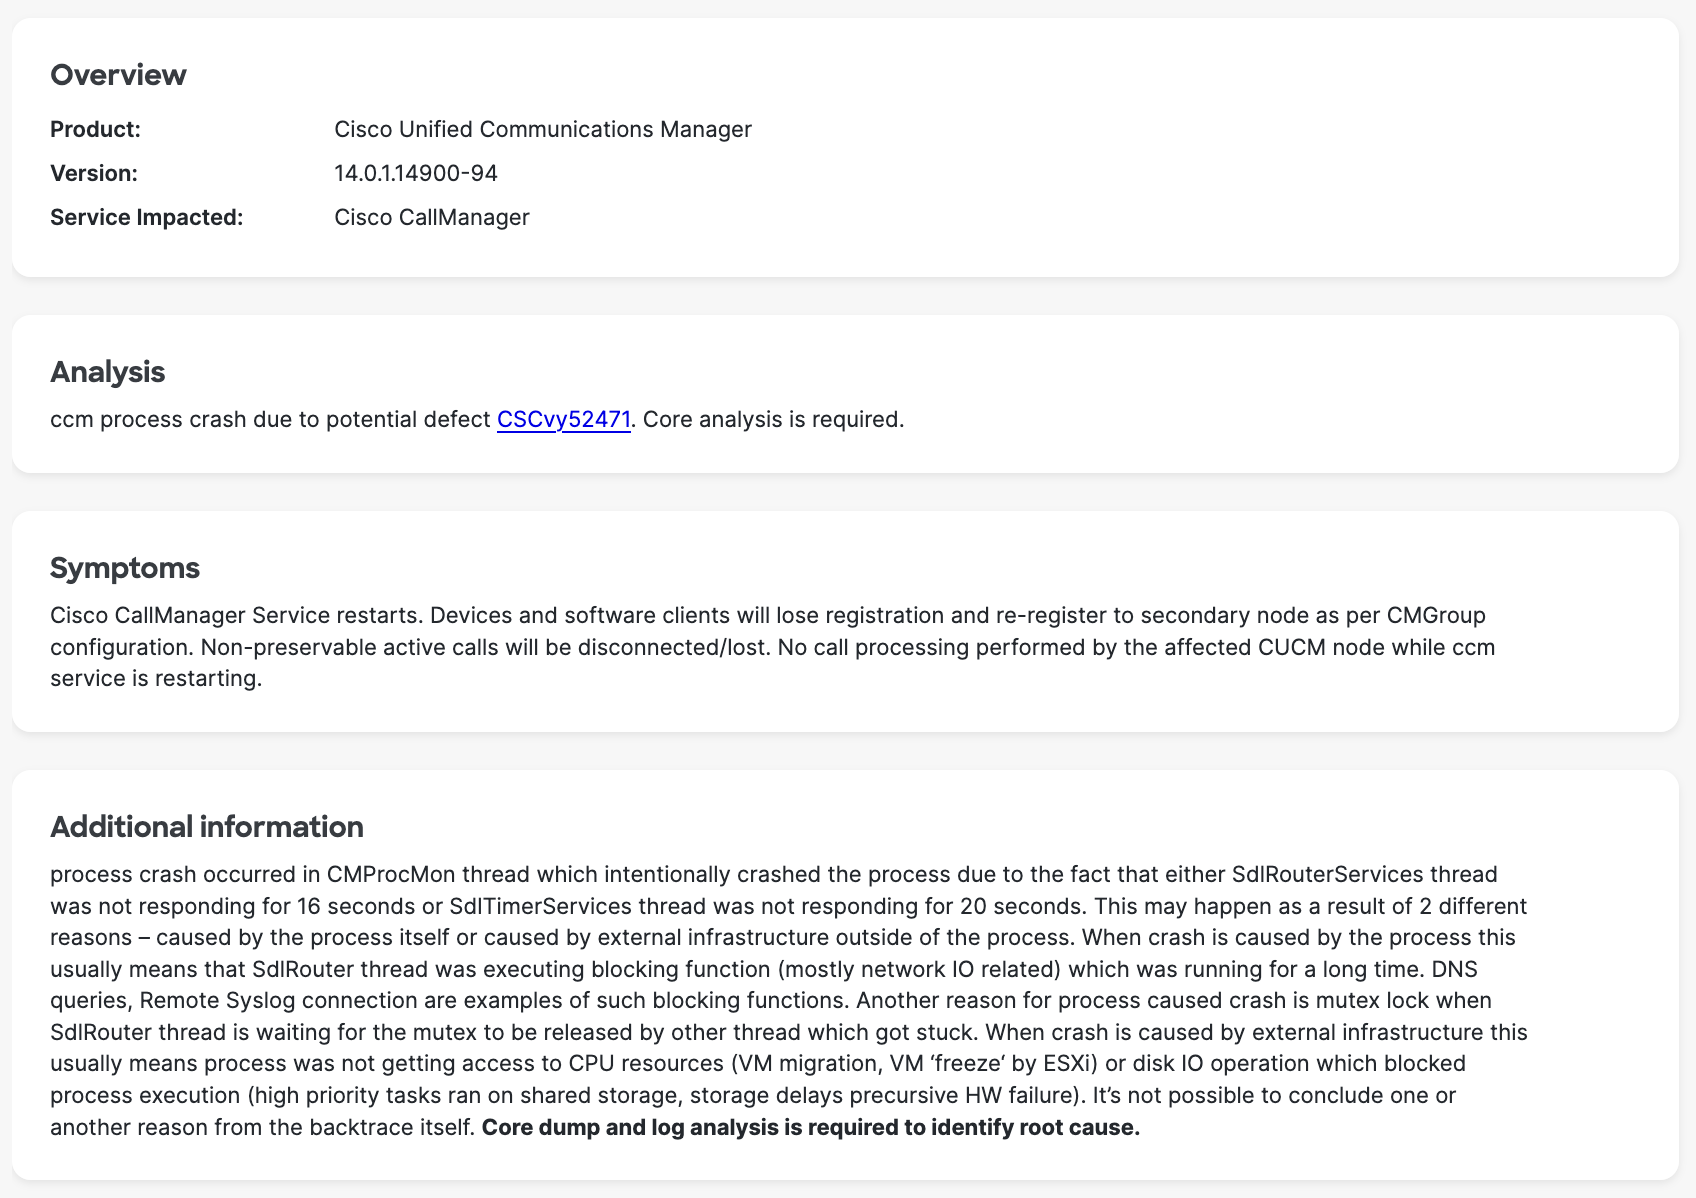
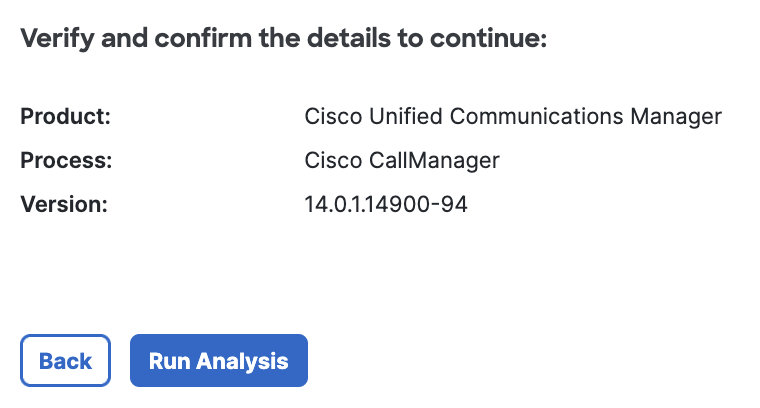
Once the input is validated, Crash Dump Analyzer returns the initial analysis results, including product information, version, and the process that crashed.
Sample output#
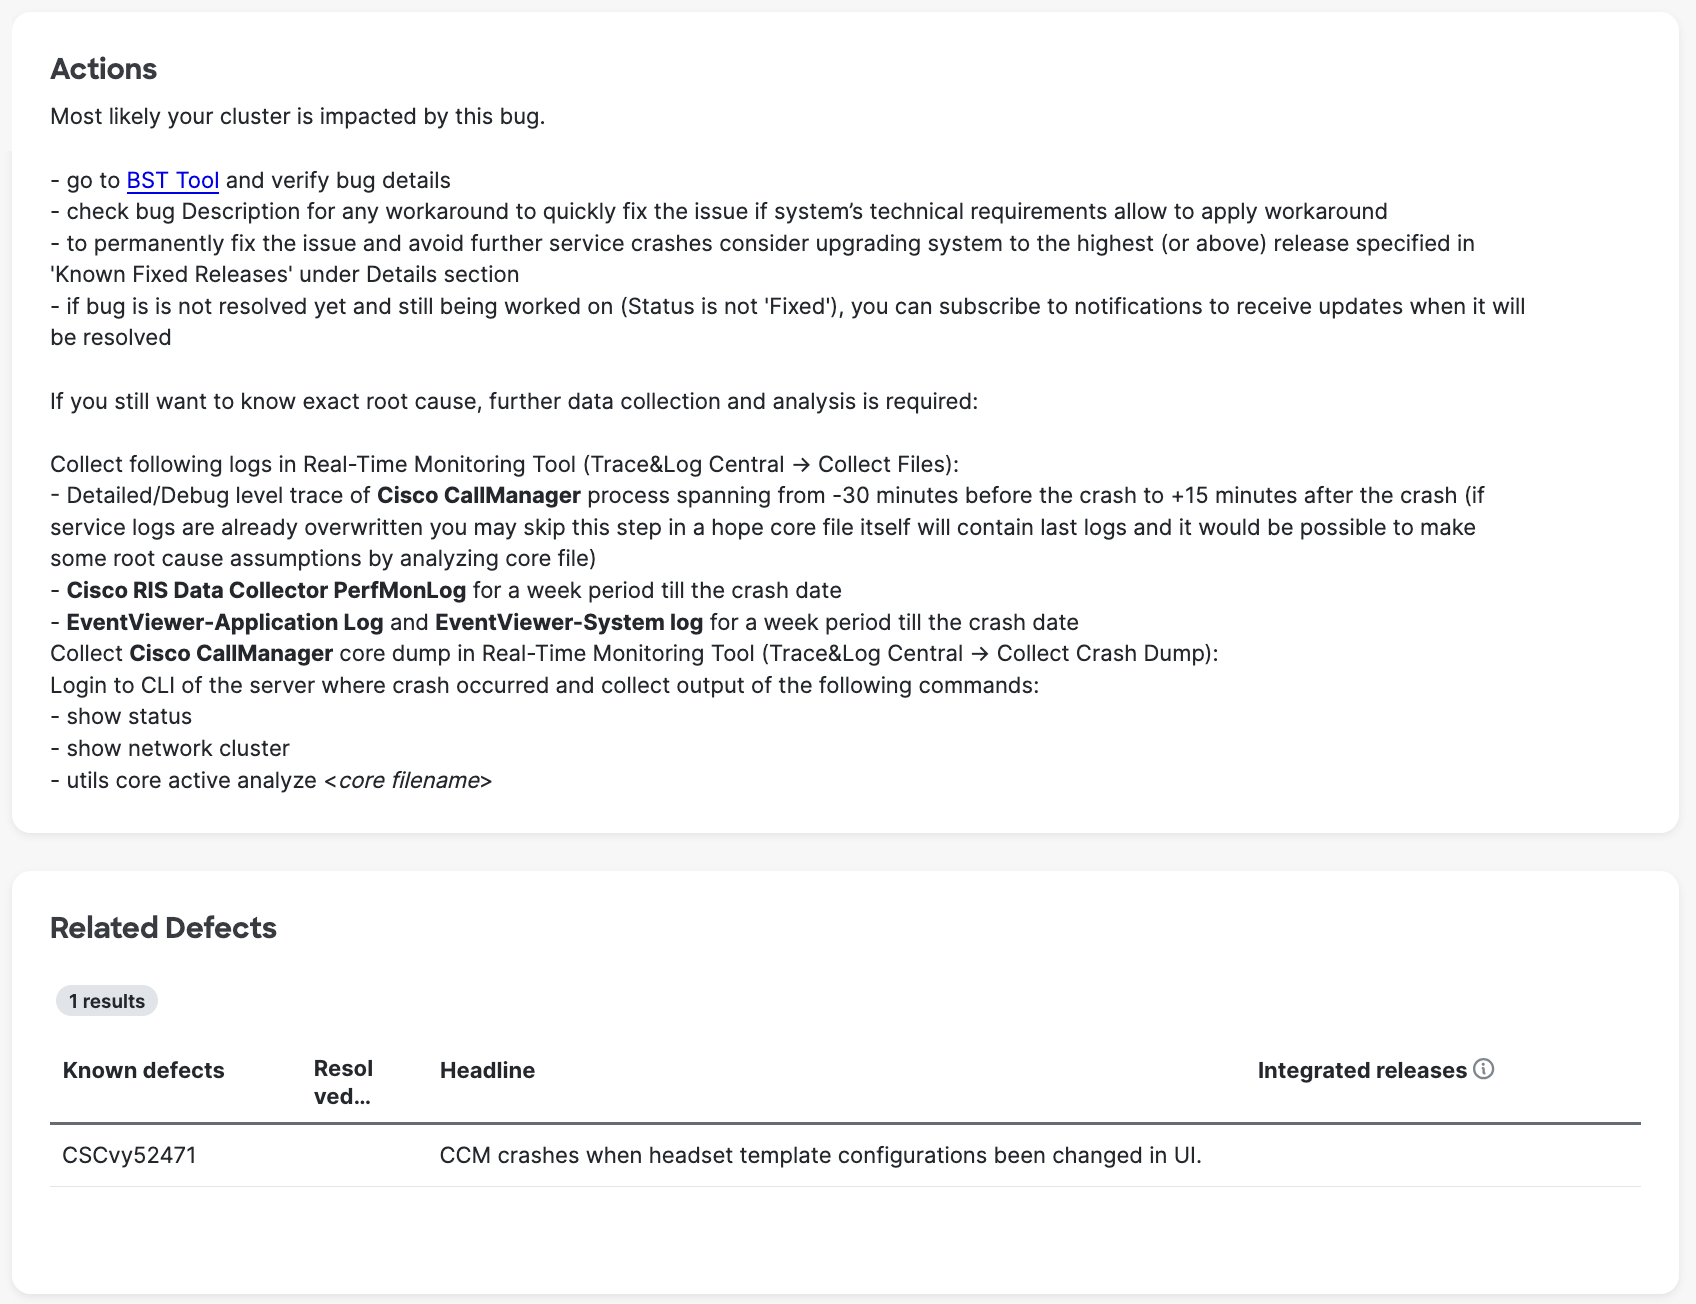
After pressing the “Run Analysis” button, the tool provides a full analysis report, including crash context, symptoms, recommended actions, and root cause analysis.