Calling Platforms#
CUCM (Cisco Unified Communications Manager)#
Supported log types
Cisco CallManager (
SDL*calllogs*)Cisco Push Notification Service (
ccmpns*) for push-notification troubleshootingCTIManager (
SDL*_200_*) for CTI-related issues
Collection method
Traces are collected using RTMT (Real-time Monitoring Tool) or WebRTMT (Web version of RTMT). Traces must be set to Detailed level, which is the default from CUCM 9.X unless configured otherwise. For step-by-step instructions on setting trace levels and downloading traces, refer to the Cisco documentation: How to Collect Traces for CUCM.
Note
Zip all files and folders created by RTMT into a single archive, preserving the original filenames and directory structure. For multiple clusters, upload one archive per cluster.
Supported Views
The Log Analyzer provides multiple views for analyzing CUCM traces. Use left/right arrows to browse views, click to fullscreen:
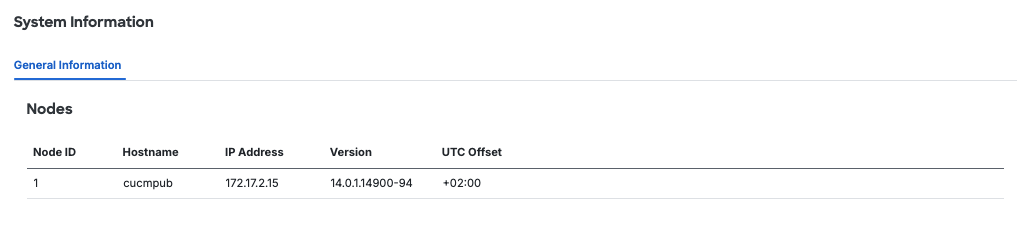
System information - brief information about the CUCM nodes found in the uploaded traces
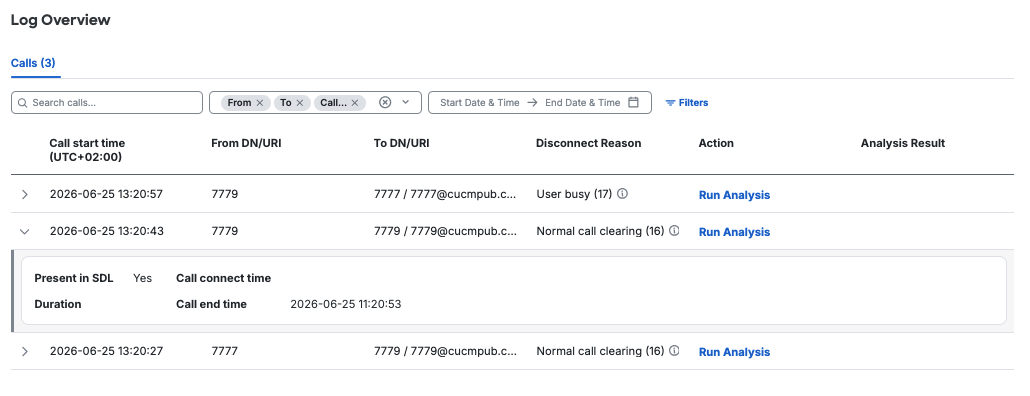
Log overview
Calls - list of all calls found within the uploaded traces
Call
Call leg info - all of the call legs found for the selected call
Ladder diagram - SIP ladder diagram for the selected call
Signaling - text representation of the SIP messages for the selected call
Annotated logs - annotations done on the logs, which list all the relevant messages for the selected call
Digit analysis - analysis of the digits sent and received during the call, including DTMF and in-band audio tones
Supported features
SIP Ladder Diagram - Visual call signaling flow with per-message annotations
Multi-protocol Call Flows - H.323, SIP, MGCP, SCCP and CTI protocol support
Call Feature Analysis - Transfer, Forward, Hold and Recording (Gateway-based and BIB)
Media Resource Tracking - Allocation and usage of MTP, Xcoder and other media resources
Mobility (SNR) - Single Number Reach call flow visualization
Note
Other call scenarios and features should work as well but are subject to continuous testing.
Analysis
Due to the nature and size of CCM/CTI SDL traces, data filtering is required and the full analysis is applied on a per-call basis only. Several steps are executed during the analysis flow:
Extract the archive and map
SDL*/calllogs*files for the same hostFind calls within SDL timelines based on SDLs/calllogs (UCM calls overview)
After selecting a call (manual step), filter only the relevant lines
Apply annotations and generate the ladder diagram based on the filtered data
Allow download of the filtered data (including related raw SDL files)
Note
The UCM calls overview page may not provide full information about a call — for instance, Disconnect reason, CI B and Call-Id can be missing or appear as multiple entries. After selecting the call, all call legs are linked and complete information is available in Call Details.
Troubleshooting Push Notification Issues
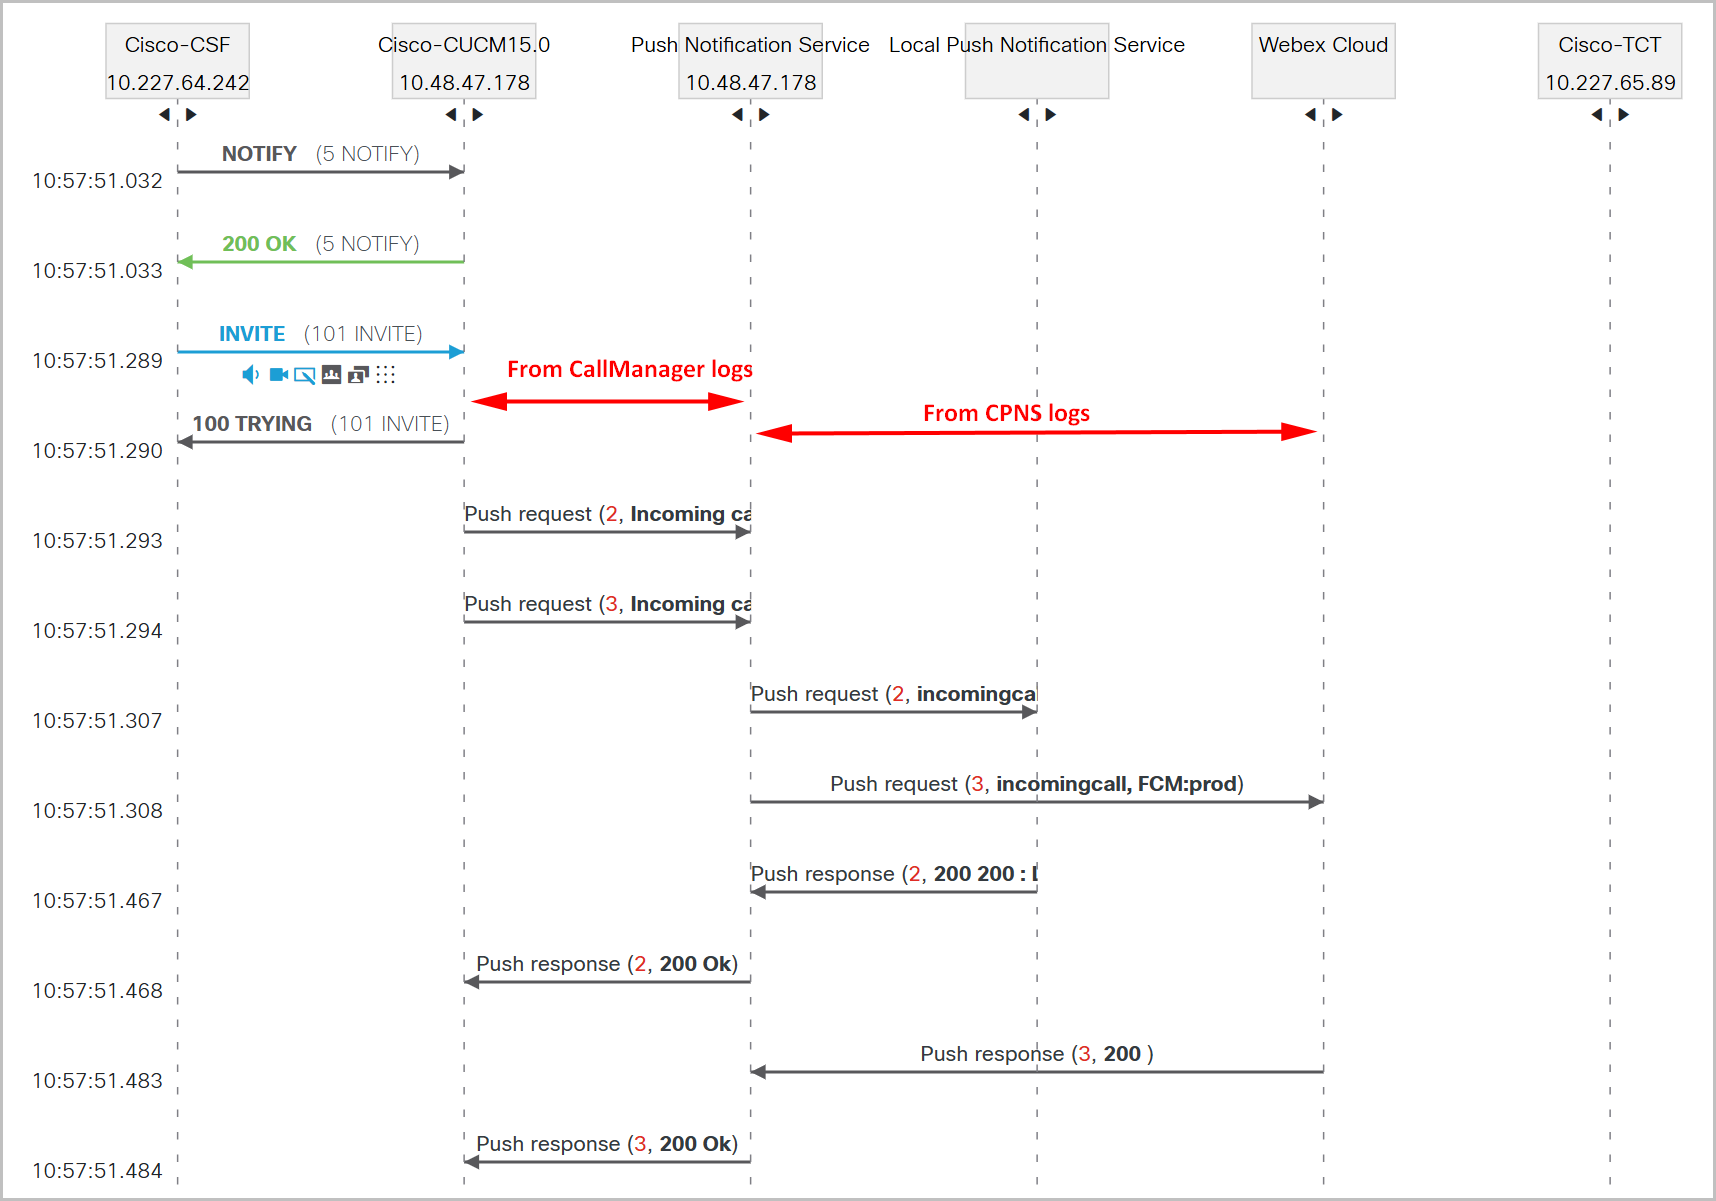
While analyzing logs, you may see Push request and Push response messages. These messages target the Push Notification Service and are used to wake a client running in the background so it can register again to receive a call. Depending on implementation and endpoint type, CSA supports the following push delivery methods:
Apple Push Notification service (APNs, delivered through the Apple cloud)
Google Push Notification (delivered through Google FCM)
Local Push Notification (delivered over local Wi-Fi)
For best results, collect both CallManager and Push Notification Service logs and upload them together to CSA. The tool correlates Push messages with CallManager messages to provide a complete call-flow view:
CUBE (Cisco Unified Border Element)#
Supported log types
SIP debug traces (
debug ccsip messages)VoIP Trace
Show tech (only when uploaded together with debug traces)
Collection method
Debug traces can be collected from the device console using terminal emulation software such as PuTTY. For detailed instructions on configuring and collecting debug traces from CUBE, refer to the Cisco documentation: Configure Debug Collection for Unified Border Element.
Note
To prevent parsing errors, please remove any unnecessary formatting characters — such as extra newlines or line breaks — from the debug output. While we make every effort to parse these files, these artifacts often prevent successful analysis.
Supported Views
The Log Analyzer provides multiple views for analyzing CUBE debug traces. Use left/right arrows to browse views, click to fullscreen:
System Overview - information about the CUBE
Calls - all of the calls found in the uploaded debugs
Call
Call leg info - all of the call legs found for the selected call
Ladder diagram - SIP ladder diagram for the selected call
Signaling - text representation of the SIP messages for the selected call
Supported features
SIP Ladder Diagram - Visual representation of SIP signaling flows and message sequences
Error Detection - Identification of failed calls, rejected requests, and protocol violations
VCS/Expressway#
Log file format
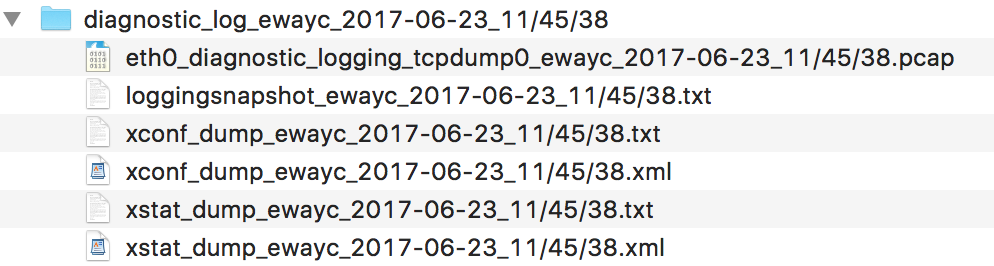
Upload the full diagnostic archive collected under Maintenance -> Diagnostics -> Diagnostic logging. Check the “take tcpdump while logging” option on the web interface to also include pcap for extended feature set of the tool. We rely on xconf and xstat (txt and xml) files to get general system information, but also some vital information required for successful main log analysis (loggingsnapshot file). We expect 1 archive per server.
Note
Default logs levels are fine for most of the analysis. Additional XMPP communication can be displayed with Mobile and Remote Access login message flow when “developer.xcp.jabber” is set to DEBUG under Maintenance -> Diagnostics -> Advanced -> Support Log configuration.
Supported features
SIP/H.323 calls
RTP streams (pcap)
SIP registrations
MRA sessions
DNS
XMPP
STUN
TCP/UDP streams (pcap)
BroadWorks (Cisco-BroadWorks Application Server)#
Log file format
The Cisco-BroadWorks Call Engine application supports the XSLog from the Application Server (AS/XS). The XSLogs are located on the AS under:
/var/broadworks/logs/appserver
bwadmin@as1-r22.bstac.net$ ls -ltr
…
-rw-rw-r--. 1 bworks  bwadmin 11559805 Aug 21 09:07 XSLog2019.08.21-06.06.32.txt
XSLog file format is always XSLogYYYY.MM.DD-hh.mm.ss.txt representing the time stamp of the file creation. Please make sure that the XSLog has the correct logging level in order for the Cisco-BroadWorks Call Engine to run correctly :
1. Call Correlation Id (External Tracking Id) Call Correlation Id (Extternal Tracking Id) must be enabled on the AS:
AS_CLI/System/CallP/CallCorrelation> get
   callCorrelationIDFormat = clusterUnique OR networkUnique

AS_CLI/Interface/SIP>
   …
   sendCallCorrelationIDAccess = true
   sendCallCorrelationIDNetwork = true
This is required and this is to ensure that different call legs can be linked together representing the same calls.
2. XSLog input channels level The minimum XSLog level for the Cisco-BroadWorks Call engine to work adequately is the following:
AS_CLI/Applications/ExecutionAndProvisioning/XS/Logging/InputChannels> get
                                            Name  Enabled    Severity
=====================================================================
                                             ...
                                           CallP     true        Info
                                             ...
                                             Sip     true        Info
                                        SipMedia     true        Info
                                            MGCP     true        Info
                                             ...
                                           OCI-C     true        Info
                                             ...
                                        Diameter     true        Info
                                             ...
                                         MediaCr     true        Info
                                             ...
Note that higher level of logging (e.g. CallP at Debug or FieldDebug) will provide more functionality for Digital Signature (DSig).
Supported features/scenarios
- Call flows with different signaling protocols:
SIP
MGCP
Diameter (Billing)
MediaCr (CFW)
OCI-C
Call features:
Originating calls
Terminating calls
SCAP (Shared Call Appearance)
SimRing (Simultaneous Ringing)
Call Recording
Etc..
Analysis
Unlike other Call Engine product, the Cisco-BroadWorks Call engine uses CallHalfs and Global CallHalfs (CallHalfs without the sub-session i.e. :0, :1, etc) values as the IP addresses for origination and destination.

The CallHalfs are used for messaging to/from a node other than the AppServer. The Global CallHalfs are used on the AppServer linking all the sub-sessions (i.e. CallHallf-XXXXXXX:0, CallHallf-XXXXXXX:1). This will be the case for example when a call is requesting the NS to be routed:

The device (10.192.83.123-085) is originating a call to the AS. The originating callhalf is callhalf-4531085:0 and the AppServer global callhalf is callhalf-4531085. This call implies a routing request to NS-10.8.5.103. The callhalf for this request is callhalf-4531085:1 and is still attached to global callhalf-4531085.
Nodes representations
Whenever possible, the Call engine will display a node with its specific roles (AppServerLegX, NS-IP, MS-IP). In general, it will try to create a new AppServerLegX so the box will represent only one incoming call (call leg) for the user. AppServerLegX still represents the same AS but it is a new call leg in terms of call processing.
Example: Call from UserA/EntA to UserB/EntB. User has call forward to C.

From the AS perspective, calling another user hosted on the same AS but not within the same enterprise is essentially seen as follow in terms of calls legs:
A origination: A to network/pstn
B termination: Network/pstn to B
The call legs are not linked/related to each other. However, the Call Engine is able to link these call legs together as represented above.
Device/Endpoint nodes:

- These nodes represents a device (EndPoint) originating or terminating a call.
Top line: Real IP + XXX where the XXX are the last three digits of the global callhalf. This is to ensure that device/endpoint are unique within the call flow. Otherwise originating and terminating device/endpoint coming/going from/to the same source/destination (e.g. both device/endpoint behind the same SBC) will appear as a single box with two callhalfs.
Middle line: Whenever possible, this will be the user’s DN.
Bottom line: CallHalf associated with this call leg.
AppServerLegX:

- These nodes represent the AS (Application Server) callhalfs call legs associated with a call
Top line: AppServerLegX. As mentioned, the Call engine will try, whenever possible, to create a single box per call originating or terminating at a user.
Middle line: The ORIG or TERM sessions.
Bottom line: Global CallHalf associated with the call legs.
NS node:

- These nodes represent the NS (Network Server) boxes.
Top line: NS + Real IP (NS-IP)
Middle line: Request type ivr, cfw-media, Routing.
Bottom line: CallHalf associated with the request
MS node:

- These nodes represent the MS (Media Server) boxes.
Top line: MS + Real IP (NS-IP)
Middle line: Request type ivr, cfw-media, Routing.
Bottom line: CallHalf associated with the request
Note
CallHalf for CFW protocol requests are prepended with cfw.
ASXintraASY node:

- These nodes are not physical nodes. They represents AS connecting calls to itself. They are created when the CallId of an outgoing INVITE is BW type and the CallId of an INVITE is the same as well as the destination (outgoing) and the origination (incoming) are the same. This is connecting AppServerLegX to AppServerLegY but this is not a physical node. So case where the INVITE is sent to secondary AS and back to primary AS will also be seen as ASXintraASY and in this case will represent a physical node.
Top line: ASXintraASY
Middle line: destination and originating DNs
Bottom line: CallHalf associated with the request
ASXpstnASY node:
- These nodes are physical nodes. They are middle points between two (or more) AppServerLegX. They are created when the CallId of an outgoing INVITE is BW type and the CallId of an INVITE is the same as well as the destination (outgoing) and the origination (incoming) IPs are different. They will also be created when the External Tracking Id is carried into the SIP messages so the terminating AppServerLegY is linked to the originating AppServerLegX (IMS case).
Top line: ASXpstnASY
Middle line: destination and originating DNs
Bottom line: CallHalf associated with the request
Diameter node:

- These nodes represent the Diameter boxes.
Top line: Diameter + Real IP (NS-IP)
Middle line: Billing.
Bottom line: CallHalf associated with the request
Note
CallHalf for Diameter protocol requests are prepended with “diam”.
IMRN node:

- These nodes represent SIP IMRN allocation and released for IMRN (BW Mobility) origination. External Tracking Ids are different for the allocation and released. The Call engine is able to link them.
Top line: IMRN
Middle line: BW Mobile Originator
Bottom line: CallHalf associated with the request