Utilities and Inputs#
Jabber version CLI script#
Currently there is no option in IM&P server user interface to list versions of Jabber clients logged into IM&P server at any give time. This tool uses data dump from server CLI to generate the report.
Log file format
There are 2 txt files required, each of which has the following format:
line 1: CLI query
line 2+: the output of CLI query
and contains one of the 2 queries:
run sql select pkid ,userid from enduser (ran on CUCM)
run pe sql ttlogin select * from clientsessions (ran on IM&P)
Example file content
query 1
admin:run sql select pkid ,userid from enduser
pkid                                 userid
==================================== ===============================================
ae003243-0632-4b79-a042-dcbc82b68485 vsidimak@ciscotac.net
query 2
admin:run pe sql ttlogin select * from clientsessions
sqlRv(t) sqlstmt(select * from clientsessions;)
***result set start***
"count(1), success(t)"
<msg><type>TTLOGIN</type><table>clientsessions</table><action>Q</action><time>0</time><old><1>4f40c76b-148d-47cc-a7d4-5d18a83c479c</1><5>1</5><6>11.8.4.52954</6><2>5e029d96-bb8d-8983-5af4-b6d70db3fd33</2><4>null</4><3>4adc1203-0eca-14cd-b5b8-3a78f76cbce6</3><0>00000001:59a31f79:000095bf:00000006</0></old></msg>
Usage tips
Since the output of queries might be large, make sure you increase the ‘Lines of scroll back’ under ‘Window’ section in Putty.
Run the query on each node in the IM&P cluster and copy the output into separate files. You will have to run the tool for each IM&P individually, or alternatively merge the outputs from different servers for the same query into 1 file, following the format above.
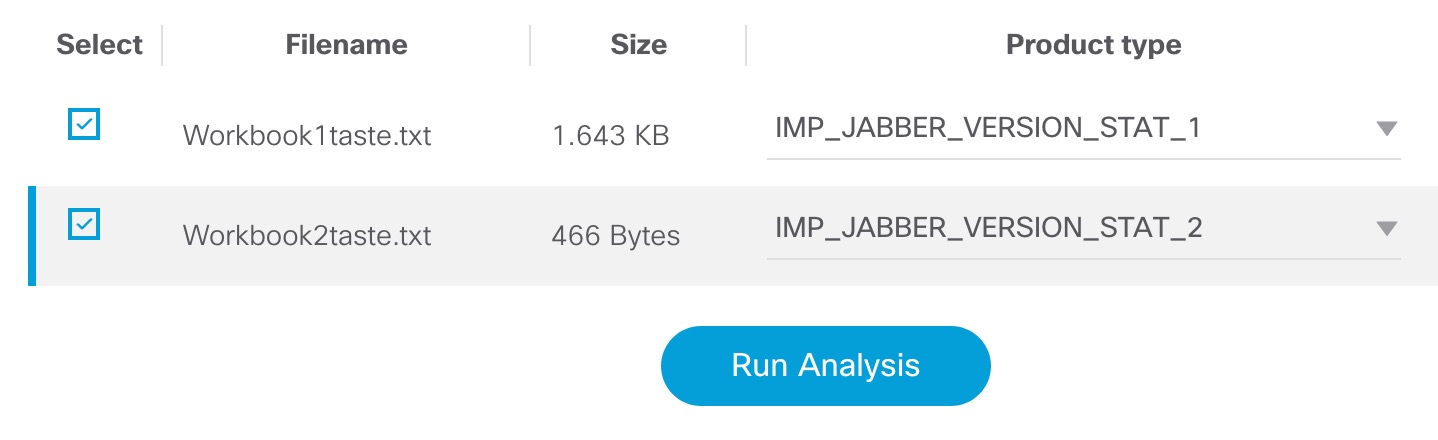
Upload the files to the tool, which will automatically detect the product types as IMP_JABBER_VERSION_STAT_1 (query 1) and IMP_JABBER_VERSION_STAT_2 (query 2) respectively.
Select both files and hit “Run analysis”.
Note
The CLI outputs only provide Real-time Jabber statistics and not historical.
Sample tool output

Dumpcfg Utility#
Log file format
Upload the dumpcfg utility logs in .txt format. Logs can be collected either from the command line or from Diagnostic Portico -> GetConfigurationCategory of a Logger.
Supported features
List of Transactions (configuration messages)
List of Tables (that had a configuration change)
PerfMon for Voice Operating System#
Log file format
Upload the archive that contains perfmon logs(Cisco RIS Data Collector PerfMonLog) collected using the RTMT tool from your Voice Operating System (CUCM,CUC,UCCX, etc.) server. The log bundle should contain PerfMon_*.csv files which record performance counters like CPUTime, VmSize(Virtual Memory Size), etc. This tool visualizes specific counters allowing you to easily spot issues.
Supported features
Before analysis, you will need to select one of the available templates:
Performance preview template (CPU, memory, IOWait)
Disk/storage troubleshooting template
CPU template
CUCM call activity template
DB replication
PCAP#
Log file format
Upload pcap file collected after stopping the trace. Generally the steps given below are followed to collect the trace.
Select the interface to capture the trace
Apply filter (if any)
Start the PCAP trace
Reproduce the issue
Stop the PCAP trace
Export the collected PCAP trace
The exported file will have .pcap file extension.
Supported features
RTP streams
DNS
TCP/UDP streams
Sample tool output
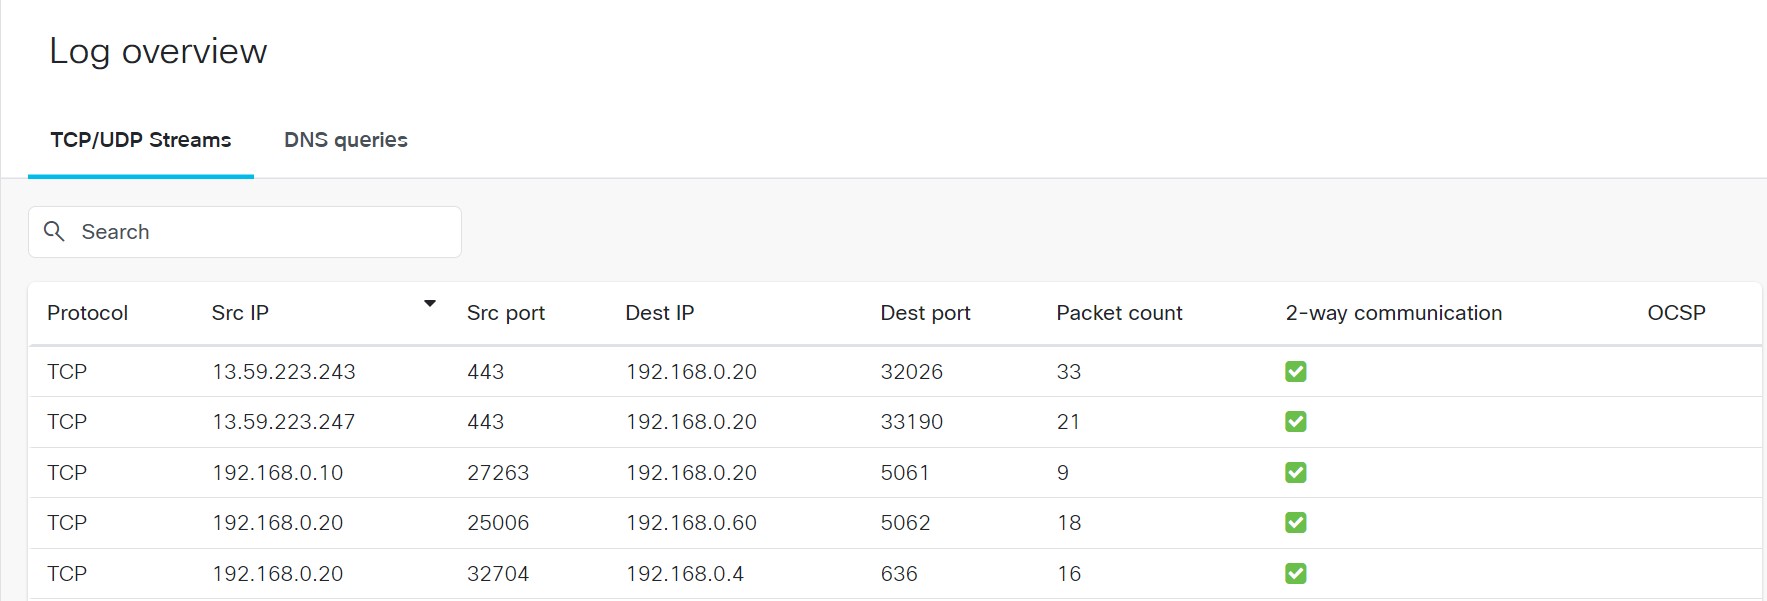
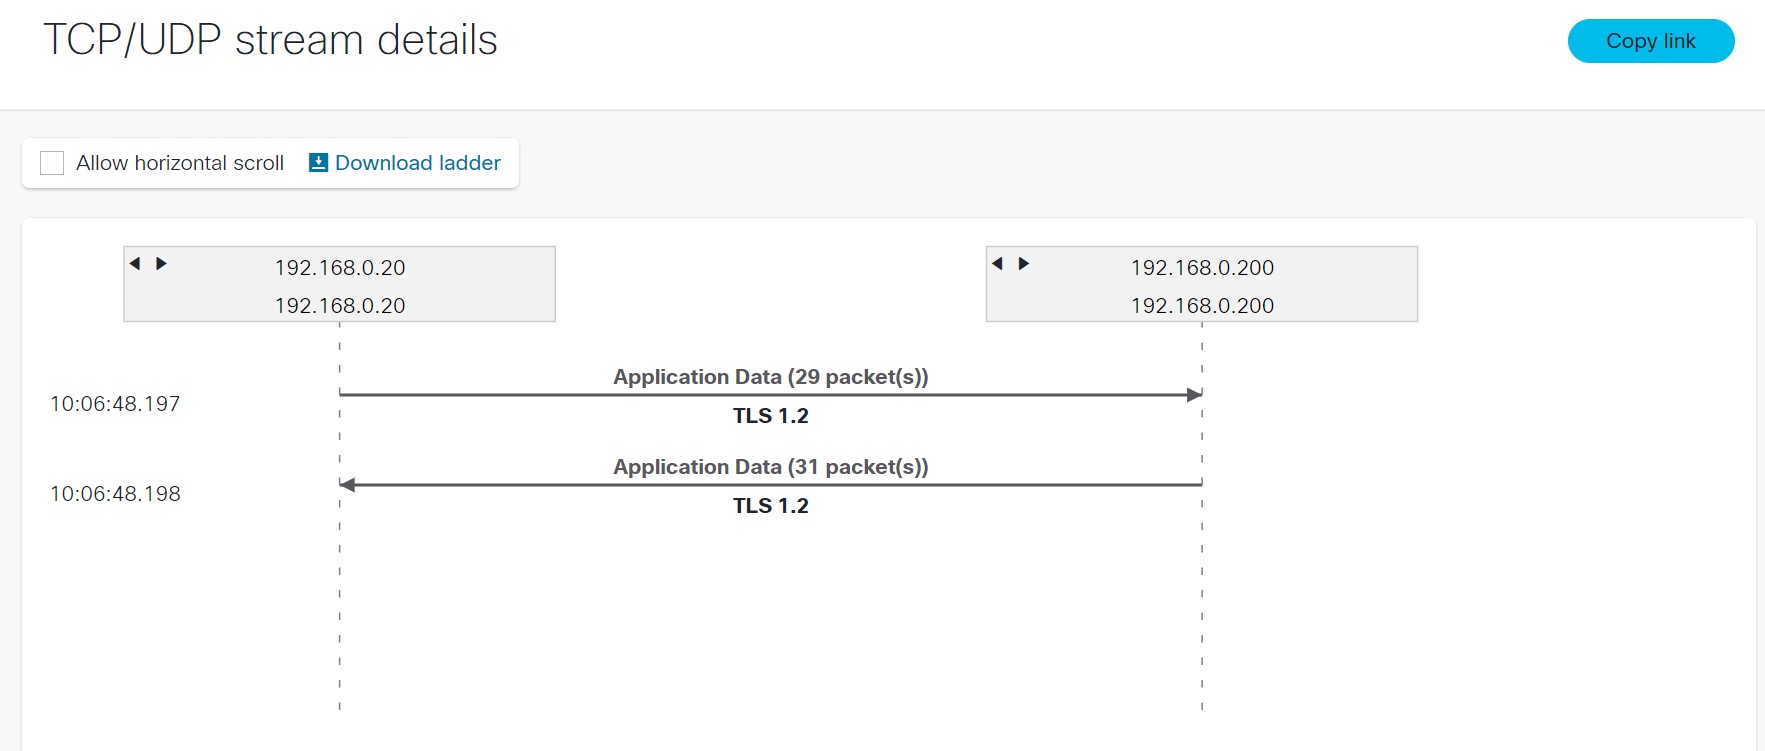
For each source and destination, we can also view the ladder diagram as shown below